Navigation
Install the app
How to install the app on iOS
Follow along with the video below to see how to install our site as a web app on your home screen.
Note: This feature may not be available in some browsers.
More options
You are using an out of date browser. It may not display this or other websites correctly.
You should upgrade or use an alternative browser.
You should upgrade or use an alternative browser.
Arctic ice thins dramatically
- Thread starter Chris
- Start date

ScienceRocks
Democrat all the way!
- Banned
- #1,622
09,06,2011, 4,576,094
2007 4,254,531*(first)
More or less 321,563km^2 from 2007s record
God if we didn't have that shitty pattern in July and early August we would of easily owned the fucking record this year.
We have 4 more days before the peak before things normally start going back up.
I think we can lose the 21,563 to get under 300 thousand between this year and 2007. Could do it tomorrow.
My prediction for Sept 10th(peak of melt season is) 4,490,000km^2 or around 20,000x4=80,000-90,000 or so melt to go.
2007 4,254,531*(first)
More or less 321,563km^2 from 2007s record
God if we didn't have that shitty pattern in July and early August we would of easily owned the fucking record this year.
We have 4 more days before the peak before things normally start going back up.
I think we can lose the 21,563 to get under 300 thousand between this year and 2007.
Could do it tomorrow.My prediction for Sept 10th(peak of melt season is) 4,490,000km^2 or around 20,000x4=80,000-90,000 or so melt to go.
ScienceRocks
Democrat all the way!
- Banned
- #1,623
Sea_ice_VOL_min_to_date
The PSC recently improved their PIOMAS model, which combines the best observational data with their own analysis. They are publishing their findings in the Journal of Geophysical Research, “Uncertainty in Modeled Arctic Sea Ice Volume”:
… the 2010 September ice volume anomaly did in fact exceed the previous 2007 minimum by a large enough margin to establish a statistically significant new record.
Extent is not really important as it is very much controlled by 1# weather, 2# wind, so in general it can be compacted more one year and spread out more another. Volume is what you must watch! Do I agree with the curve put on this? Not really, but it is trending within the past decade like it...Honestly we don't know what the future will do, but for what we do know that is what it is.
Last edited:

Old Rocks
Diamond Member
LOL. A volume reduction of 75%, and that is ol' Walleyes reply.
LOL. A volume reduction of 75%, and that is ol' Walleyes reply.
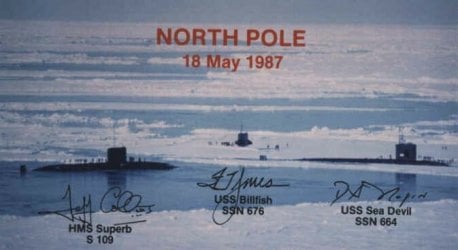
My reply is all that was warranted. When you have something new and interesting I will reply in kind. This is just more of the same. I'm still trying to figure out how you thought the people rowing to the "North Pole" were actually at the North Pole. I guess you really don't know where it's at.
ScienceRocks
Democrat all the way!
- Banned
- #1,628
Sept 10th is the peak and we're offically going back up!!! We ended up with a solid second for 2011! We missed it by less then 3 solid 100 thousand melt days in July. Could of easily done it if it wasn't for that 3 weeks in July-August.
09,09,2011, 4526875
09,09,2011, 4526875
Last edited:
ScienceRocks
Democrat all the way!
- Banned
- #1,629

You can clearly see that the Darker shades are not even half the size this year as in 2007...When thinking about the volume that is telling. It was more spread out this year, but there was less. More compacted in 2007, so extent was slightly less...I've come to the conclusion that volume is far more important.
Remember the volume graph I posted above.
2007 6.5 million km^3 to this years 4.3 million km^3...That is 2.2 million km^3 drop over 2007...Pretty hard to miss. 2007 was just really compacted.
I don't know how we can't come to agreement with something that is this straight forward. Do you agree with what I'm saying Gssack, Westwall or even wirebender? The volume is down and the extent graph shows less darker shades=less thick ice. Both show that the volume is likely less, so there is no reason why both sides can't shack hands on this. Do we have agreement?
Ok, for
09,11,2011, 4519375
Less then -10,000 over yesterday. But likely to be revised in the morning to close to the amount it went down...So we will have to see, but 9-9 could of been the bottom, but there is a slim chance if it only gets revised 6,000 tomorrow morning that we could have a new low point...Not likely, but we will see.
Last edited:
ScienceRocks
Democrat all the way!
- Banned
- #1,630

Sea_ice_VOL_min_to_date
The PSC recently improved their PIOMAS model, which combines the best observational data with their own analysis. They are publishing their findings in the Journal of Geophysical Research, Uncertainty in Modeled Arctic Sea Ice Volume:
the 2010 September ice volume anomaly did in fact exceed the previous 2007 minimum by a large enough margin to establish a statistically significant new record.

Extent is not really important as it is very much controlled by 1# weather, 2# wind, so in general it can be compacted more one year and spread out more another. Volume is what you must watch! Do I agree with the curve put on this? Not really, but it is trending within the past decade like it...Honestly we don't know what the future will do, but for what we do know that is what it is.

- Thread starter
- #1,631
Researchers from the University of Bremen have announced that 2011s Arctic Sea Ice Minimum is the smallest in recorded history, coming in under the previous lowest Minimum in September of 2007.
The Arctic sea ice extent reached its minimum on September 8 of this year, at 4.24 million square kilometres. This, compared to the 4.267 million square kilometres reached back in 2007, and down from 15 million square kilometres during the peak of winter.
The decline of summer ice is already 50 percent since 1972. For small organisms that live on the underside of the ice and also the starting point of the human food chain are also for us, leaving less and less habitat, said Dr George Heygster.
2011 a Historic New Arctic Sea Ice Minimum – Planetsave
ScienceRocks
Democrat all the way!
- Banned
- #1,632
Yes,
Bremen for sea ice is like RSS is to global temperatures. So one out of the three have this year with the record.
I post Jaxa in the arctic ice thread....Which should be second.


Cryosphere today also set a record over 2007...So 2 out of 4. Jaxa, nsidc aren't likely to beat the record...Nsidc will be close.
Bremen for sea ice is like RSS is to global temperatures. So one out of the three have this year with the record.
I post Jaxa in the arctic ice thread....Which should be second.
Cryosphere today also set a record over 2007...So 2 out of 4. Jaxa, nsidc aren't likely to beat the record...Nsidc will be close.
Last edited:
- Thread starter
- #1,633
The amount of Arctic sea ice has melted to a historic low, with the area of land covered by ice at the smallest level since scientists began observing it with satellites in 1972, researchers from the University of Bremen in Germany report.
The North Pole skull cap shrank to about half a percent under the previous record low set in September 2007, according to the school's Institute of Environmental Physics.
Researchers, including those from the National Snow and Ice Data Center, had predicted earlier this summer that Arctic sea ice levels could reach extreme lows. But the University of Bremen physicists said there was uncertainty in July about whether the ice melt would surpass the previous record.
They said their studies indicated that continuing ice decline was related to man-made global warming.
"It seems to be clear that this is a further consequence of the man-made global warming with global consequences," researchers said in their report. "Directly, the livehood of small animals, algae, fishes and mammals like polar bears and seals is more and more reduced."
Arctic ice levels hit historic low, researchers say – This Just In - CNN.com Blogs
ScienceRocks
Democrat all the way!
- Banned
- #1,634
jaxa was revised 20 thousand upwards....453k now. melt season is over. I was reading discussion that Jaxa may not have the ability as bremen has in seeing the smaller area's, oh, well. this is backed up by the offical ncis that is now going up.
I predict for the max 13.4 million km^2
I've come to the conclusion that extent is very much control by weather(wind and clouds)...Yes it is important for a open ocean absorbs the energy and warms up, but only for that. Even a half of a meter of ice is not much different then 3 meters in its ability to reflect energy off the ice(sure maybe slightly faster melting being the former is most likely first year ice).
Volume is WHAT is important. No it doesn't matter that much in the ability to reflect solar energy as discused above, but it is the true nature of the ice.
Lets imagine what I'm saying for a second
2007 had 4.2 million km^2, but thickness of 3-4 meters upwards of 5-6. 2007 had 6.4 million km^2 in total volume of the ice...So the thick ice was far more compacted within a smaller area pushed by the winds.
2011 had 4.35 million km^2 on the offical nsic. But had 4.3 million km^3 of volume. You better believe it is spread out big time. You can see it within the "extent maps" with far less deep purples and more lighter colors spread over a larger area.
---The volume was taken in August...It could be some what lower for September---
Last edited:
ScienceRocks
Democrat all the way!
- Banned
- #1,635
Up we go
09,12,2011,4542656
09,13,2011,4589844
09,14,2011,4578594
Should be revised to 4,590,000 something tomorrow morning.
09,12,2011,4542656
09,13,2011,4589844
09,14,2011,4578594
Should be revised to 4,590,000 something tomorrow morning.
jaxa was revised 20 thousand upwards....453k now. melt season is over. I was reading discussion that Jaxa may not have the ability as bremen has in seeing the smaller area's, oh, well. this is backed up by the offical ncis that is now going up.
I predict for the max 13.4 million km^2
I've come to the conclusion that extent is very much control by weather(wind and clouds)...Yes it is important for a open ocean absorbs the energy and warms up, but only for that. Even a half of a meter of ice is not much different then 3 meters in its ability to reflect energy off the ice(sure maybe slightly faster melting being the former is most likely first year ice).
Volume is WHAT is important. No it doesn't matter that much in the ability to reflect solar energy as discused above, but it is the true nature of the ice.
Lets imagine what I'm saying for a second
2007 had 4.2 million km^2, but thickness of 3-4 meters upwards of 5-6. 2007 had 6.4 million km^2 in total volume of the ice...So the thick ice was far more compacted within a smaller area pushed by the winds.
2011 had 4.35 million km^2 on the offical nsic. But had 4.3 million km^3 of volume. You better believe it is spread out big time. You can see it within the "extent maps" with far less deep purples and more lighter colors spread over a larger area.
---The volume was taken in August...It could be some what lower for September---
Hmmmm the plot thickens......
"Any theories about this? NSIDC shows a huge loss of multi-year ice (green) around the pole, Greenland, and the Canadian Archipelago since the end of July. Given that temperatures in those regions have been quite cold since the end of July, Im having a really tough time understanding what happened.
Much of that region has been below freezing for essentially the entire period.
Satellite data showed essentially no ice loss in that region since the end of July, much less loss of thick multi-year ice. Multiyear ice doesnt just disappear without open water appearing. There was never any open water in most of the affected areas.
What their maps show is that the ice got younger, not melted. How does ice get younger?"
NSIDC Multiyear Ice Disappears | Real Science
ScienceRocks
Democrat all the way!
- Banned
- #1,637
On September 9, 2011 sea ice extent dropped to 4.33 million square kilometers (1.67 million square miles). This appears to have been the lowest extent of the year, and may mark the point when sea ice begins its cold-season cycle of growth. However, a shift in wind patterns or late season melt could still push the ice extent lower.
This year's minimum was 160,000 square kilometers (61,800 square miles) above the 2007 record minimum extent, and 2.38 million square kilometers (919,000 square miles) below the 1979 to 2000 average minimum. Note that our estimated uncertainty for extent is plus or minus 50,000 square kilometers (about 20,000 square miles). The minimum ice extent this year is very close to 2007, and indeed some other research groups place 2011 as the lowest on record. At this point, using our processing and sensor series, the 2011 minimum is a close second
http://nsidc.org/arcticseaicenews/index.html
Do you people have any idea how tiny 160 thousand square km are when dealing with arctic sea ice? That is less then two days of melt within July. If the pattern hadn't gone straight to hell in July into early August or were better for September...We would of easily beaten it.
Last edited:
Old Rocks
Diamond Member
jaxa was revised 20 thousand upwards....453k now. melt season is over. I was reading discussion that Jaxa may not have the ability as bremen has in seeing the smaller area's, oh, well. this is backed up by the offical ncis that is now going up.
I predict for the max 13.4 million km^2
I've come to the conclusion that extent is very much control by weather(wind and clouds)...Yes it is important for a open ocean absorbs the energy and warms up, but only for that. Even a half of a meter of ice is not much different then 3 meters in its ability to reflect energy off the ice(sure maybe slightly faster melting being the former is most likely first year ice).
Volume is WHAT is important. No it doesn't matter that much in the ability to reflect solar energy as discused above, but it is the true nature of the ice.
Lets imagine what I'm saying for a second
2007 had 4.2 million km^2, but thickness of 3-4 meters upwards of 5-6. 2007 had 6.4 million km^2 in total volume of the ice...So the thick ice was far more compacted within a smaller area pushed by the winds.
2011 had 4.35 million km^2 on the offical nsic. But had 4.3 million km^3 of volume. You better believe it is spread out big time. You can see it within the "extent maps" with far less deep purples and more lighter colors spread over a larger area.
---The volume was taken in August...It could be some what lower for September---
Hmmmm the plot thickens......
"Any theories about this? NSIDC shows a huge loss of multi-year ice (green) around the pole, Greenland, and the Canadian Archipelago since the end of July. Given that temperatures in those regions have been quite cold since the end of July, Im having a really tough time understanding what happened.
Much of that region has been below freezing for essentially the entire period.
Satellite data showed essentially no ice loss in that region since the end of July, much less loss of thick multi-year ice. Multiyear ice doesnt just disappear without open water appearing. There was never any open water in most of the affected areas.
What their maps show is that the ice got younger, not melted. How does ice get younger?"
NSIDC Multiyear Ice Disappears | Real Science
What else would one expect from you, Walleyes? If an area for the time of instrumental measurement has had ice three years or more thick, in words you can understand, ice layers for three years or more, then this year, it only has layers for two years, it has gotten younger. It is two year old ice, it has layers that represent only two years of accumulation.
ScienceRocks
Democrat all the way!
- Banned
- #1,639
ScienceRocks
Democrat all the way!
- Banned
- #1,640
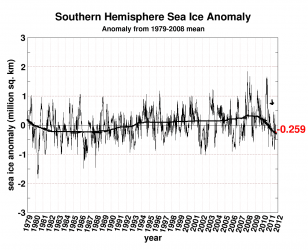
The Antarctic anomaly chart shows something big...We hit the peak in 2009, but have turned around since and are now based on my "black means" line to the point we were in the late 1980s or early 1990's within the past year or so. We need a few more years, but this appears like a reverse to me. YES, I'm saying it is possible the last 2 years wiped out the increase we had all the way back to the early 1990s.
Attachments
Last edited:
Similar threads
- Replies
- 10
- Views
- 1K
- Replies
- 221
- Views
- 6K
Latest Discussions
- Replies
- 44
- Views
- 163
Forum List
-
-
-
-
-
Political Satire 8497
-
-
-
-
-
-
-
-
-
-
-
-
-
-
-
-
-
-
-
ObamaCare 781
-
-
-
-
-
-
-
-
-
-
-
Member Usernotes 482
-
-
-
-
-
-
-
-
-
-