Forget Climategate: this ‘global warming’ scandal is much bigger

Post 107, Westwall

Yes, but it is inconsistent, thus it is not reliable, thus it is relegated to hearsay evidence. 1970 is whenY systematic, ACCURATE measurements began. What is science? MEASUREMENT. That is what science is about. You didn't know this? Huh.

Post 123, Westwall

Proving that it's you who has no clue what you're talking about, the RN sailed on set routes due to prevailing winds and currents. Those routes are well documented and known. Further, they took the temp records at the same times each day when at all possible. Were very rigorous with navigational data so we know exactly where they were, when they were, what time they were there, etc. In other words, NOT RANDOM.

It was also common for the naturalists to travel on the RN ships to conduct their studies. Those records are kept in various places including the PRO in London.

"Centuries later, that rigorously acquired information is being put to good use, providing a trove of archival data to scientists who are trying to fill in the details of our knowledge about the atmosphere and the changing climate."

Looks a major shifting of gears here. Notice Westwall hasn't posted his usual, "There is a major cooling trend in progress" nonsense lately, also.

Thanks for reminding me...

trend


Still cooling....
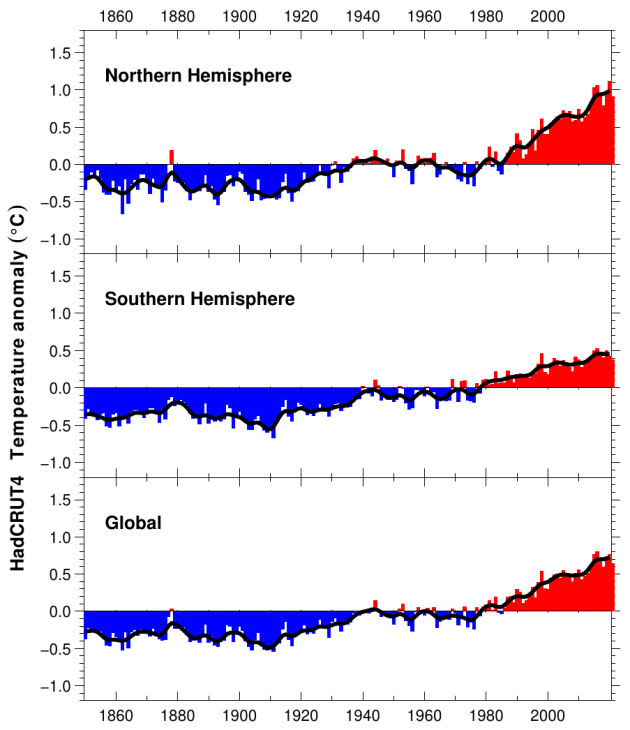
Link for where that graph is from, asshole.
 
trend


Still cooling....

Satellite Data shows the CAGW fraud really well...
Escalator500.gif
So your an ENSO DENIER... you think that the step increases are from man when they can be shown empirically to be caused by the ENSO, ADO, PDO and its warm phases.

Your sooooo predictable. And addicted to Skeptical Science lies..
 
Last edited:
No they are not. They are two completely different data sets. the one you call "old" is a single uncalibrated dataset (singular), and the one you call "new" is a combination of several (plural) calibrated data sets (plural)

You really need to learn how to use the quote function..

Homogenization of data sets causing the alteration of the single point. I am very well aware of the lie that it creates.. The Old is the single site. The New is the new and improved homogenized data set, hence the data set number being different.. ITS GARBAGE and a LIE! It is also being done all over the globe in an attempt to further the CAGW LIE!
 
trend


Still cooling....

Satellite Data shows the CAGW fraud really well...
Escalator500.gif
So your an ENSO DENIER... you think that the step increases are from man when they can be shown empirically to be caused by the ENSO, ADO, PDO and its warm phases.

Your sooooo predictable. And addicted to Skeptical Science lies..
But aren't there also supposed to be cooling phases? There has been no real cooling phase for the past 100 years. There are warming phases followed by flat phases followed by warming phases starting just about where the previous warming phase left off. Something is interfering with the cold cycle the last 100 years. What do you suppose it is?

Another simple answer... Its the Sun and the fact we have just left a very active phase of the solar cycle. Earths Energy budget was fairly close to equilibrium and as a result there were short bursts of warming caused by the ocean and the suns input then maintained the level until the next warm phase.

What comes next is going to stun the global warming alarmist as we fall into the cooling side of solar output. When the suns input will not maintain the warmth caused by the oceans warm phase. The Antarctic is already showing us what the cooling coming is going to be like..
 
No they are not. They are two completely different data sets. the one you call "old" is a single uncalibrated dataset (singular), and the one you call "new" is a combination of several (plural) calibrated data sets (plural)

You really need to learn how to use the quote function..

Homogenization of data sets causing the alteration of the single point. I am very well aware of the lie that it creates.. The Old is the single site. The New is the new and improved homogenized data set, hence the data set number being different.. ITS GARBAGE and a LIE! It is also being done all over the globe in an attempt to further the CAGW LIE!
No, the new set ends in ID zero, it is a composite of several calibrated data sets. The old set ending in ID three is one uncalibrated data set of at least 3, there might be more, but the ID ending in 3 means there must be at least 3.

Version 3, which is the new graph, is a composite of all the data sets for that site after they have been calibrated to the instrument currently being used at that site.

If you would take the time to read the FAQs that the NCDC provides you would know that the dishonest blink graph is comparing a partial uncalibrated data set to a calibrated complete set.
 
FORTRAN is unforgiving... That inserted line will cause a hockey stick in any data set its applied to... white noise or random numbers as well...

Good thing it was only used on test data then. Billy here is lying outright by claiming it was used to generate results from actual data.

Billy has been informed of that before. He doesn't care. When any of his lies get debunked, he just waits a bit and then tells the same lie again. That eliminates ignorance as a possible excuse for him lying, and graduates him into the class of a deliberate fraudster.

That's why normal people find the deniers to be so offensive to their sense of basic decency and honesty. If a given denier isn't an outright fraud like Billy, that denier is at least running cover for the fraudsters.

Mamooth lying again... you dont even know that for about 25 years it was the only program which could be used in climate modeling... what a moron.. and a liar to boot..
 
No they are not. They are two completely different data sets. the one you call "old" is a single uncalibrated dataset (singular), and the one you call "new" is a combination of several (plural) calibrated data sets (plural)

You really need to learn how to use the quote function..

Homogenization of data sets causing the alteration of the single point. I am very well aware of the lie that it creates.. The Old is the single site. The New is the new and improved homogenized data set, hence the data set number being different.. ITS GARBAGE and a LIE! It is also being done all over the globe in an attempt to further the CAGW LIE!
No, the new set ends in ID zero, it is a composite of several calibrated data sets. The old set ending in ID three is one uncalibrated data set of at least 3, there might be more, but the ID ending in 3 means there must be at least 3.

Version 3, which is the new graph, is a composite of all the data sets for that site after they have been calibrated to the instrument currently being used at that site.

If you would take the time to read the FAQs that the NCDC provides you would know that the dishonest blink graph is comparing a partial uncalibrated data set to a calibrated complete set.

Keep on reaching... You will get there eventually...
 
trend


Still cooling....

Satellite Data shows the CAGW fraud really well...
Escalator500.gif
So your an ENSO DENIER... you think that the step increases are from man when they can be shown empirically to be caused by the ENSO, ADO, PDO and its warm phases.

Your sooooo predictable. And addicted to Skeptical Science lies..
But aren't there also supposed to be cooling phases? There has been no real cooling phase for the past 100 years. There are warming phases followed by flat phases followed by warming phases starting just about where the previous warming phase left off. Something is interfering with the cold cycle the last 100 years. What do you suppose it is?

Another simple answer... Its the Sun and the fact we have just left a very active phase of the solar cycle. Earths Energy budget was fairly close to equilibrium and as a result there were short bursts of warming caused by the ocean and the suns input then maintained the level until the next warm phase.

What comes next is going to stun the global warming alarmist as we fall into the cooling side of solar output. When the suns input will not maintain the warmth caused by the oceans warm phase. The Antarctic is already showing us what the cooling coming is going to be like..
Deniers have been predicting that coming "Ice Age" since the 1970s, and still we keep warming.
Guess again.

I don't suppose you are willing to give a timetable for this overwhelming cooling solar phase.
 
No they are not. They are two completely different data sets. the one you call "old" is a single uncalibrated dataset (singular), and the one you call "new" is a combination of several (plural) calibrated data sets (plural)

You really need to learn how to use the quote function..

Homogenization of data sets causing the alteration of the single point. I am very well aware of the lie that it creates.. The Old is the single site. The New is the new and improved homogenized data set, hence the data set number being different.. ITS GARBAGE and a LIE! It is also being done all over the globe in an attempt to further the CAGW LIE!
No, the new set ends in ID zero, it is a composite of several calibrated data sets. The old set ending in ID three is one uncalibrated data set of at least 3, there might be more, but the ID ending in 3 means there must be at least 3.

Version 3, which is the new graph, is a composite of all the data sets for that site after they have been calibrated to the instrument currently being used at that site.

If you would take the time to read the FAQs that the NCDC provides you would know that the dishonest blink graph is comparing a partial uncalibrated data set to a calibrated complete set.

Keep on reaching... You will get there eventually...
Data.GISS GISS Surface Temperature Analysis GISTEMP -- Updates to Analysis

December 14, 2011: GHCN v2 and USHCN data were replaced by the adjusted GHCN v3 data. This simplified the combination procedure since some steps became redundant (combining different station records for the same location, adjusting for the station move in the St. Helena record, etc).
 
So far we have as a rebuttal an admission that yes the records have been altered but then opinion is rendered as to why. Further, whenever we look at the data alterations they are ALWAYS cooler. Never has a "adjustment" gone the opposite direction.

A thinking person would ask themselves why that is. A thinking person would also ask to see the raw data, the siting information, the calibration data, the maintenance records etc. You fraudsters never do. Why is that?
That is a complete and total lie no thinking person would be stupid enough to believe. Deniers just make that shit up with no proof at all! The Pairwise Homogenization Algorithm (PHA) makes adjustments upwards and downward.

The PHA software is used to detect and account for historical changes in station records that are caused by station moves, new observation technologies and other changes in observation practice. These changes often cause a shift in temperature readings that do not reflect real climate changes. When a shift is detected, the PHA software adjusts temperatures in the historic record upwards or downwards to conform to newer measurement conditions. In this way, the algorithm seeks to adjust all earlier measurement eras in a station’s history to conform to the latest location and instrumentation.

The Pairwise Homogeneity Adjustment algorithm software is available online at ftp://ftp.ncdc.noaa.gov/pub/data/ghcn/v3/software/ .

Show us a measurement then.
Here you go lazy bones, the blue to purple areas in the third column are the changes from V2 to V3 that were adjusted down, the yellow to red were adjusted up, the white areas were unchanged. Now man up and admit you lied when you parroted your denier source who fed you the bullshit that all the adjustments were in one direction.

This was your exact quote:"Further, whenever we look at the data alterations they are ALWAYS cooler. Never has a "adjustment" gone the opposite direction."

Data.GISS GISTEMP Analysis Updates GHCN-M V3 vs. V2

standard.gif
 
Last edited:
You are the one claiming it's a fake scandal.

That's not how science works. You presented a new theory that contradicts the currently accepted science. It's an extraordinary claim on your part, so it requires extraordinary evidence to back it up.

So far we have as a rebuttal an admission that yes the records have been altered but then opinion is rendered as to why.

Previous to this particular conspiracy, it was your side demanding that the raw data not be used, and that more and bigger modifications were necessary. The whole denier community was screaming that more modifications to the raw data were required because of stations moving, construction near stations, changes in instrument types and UHI effects. By doing that, deniers conceded that adjustments to the raw data are necessary for accuracy. Deniers don't get to do a complete flipflop on that issue now unless they can explain why such a flipflop is justified.

Further, whenever we look at the data alterations they are ALWAYS cooler. Never has a "adjustment" gone the opposite direction.

A false claim. That's not even true for land stations. And for ocean stations, which account for 70% of the surface, the corrections always make the past look warmer.

A thinking person would ask themselves why that is. A thinking person would also ask to see the raw data, the siting information, the calibration data, the maintenance records etc. You fraudsters never do. Why is that?

Back to your conspiracy theory you go. The only response needed is to point out it's a paranoid fantasy.

Those who created this recent conspiracy theory deliberately left out the oceans, where all the adjustments are to make the past temps warmer, thus making the current warming look smaller. It's a cherrypick so brazen, I can think of no other explanation for it besides deliberate fraud on the part of the conspiracy theory authors.

If zero adjustments were made to the raw data, the current warming trend would look _larger_.

Instead, scientists make those necessary adjustments, and the current warming trend ends up looking _smaller_.

And so your conspiracy theory goes boom.

Deniers, of course, couldn't have known that. Their cult leaders didn't inform them of the fact of the ocean adjustments, and they shun non-cult sources, so deniers had no way of knowing. Now they do know, and they're flailing. They know their cult was wrong, but it's absolutely forbidden for them to say that their cult was wrong. Hence, the cultists are reduced to inventing new ways to deflect from the issue, which is that they were caught red-handed repeating a baseless conspiracy theory.
well, again interesting, here you are in another thread and still no experiment. you come in here and request evidence yet ignore the requests to you. Just curious, do you see this as fair?
 

Forum List

Back
Top