ThoughtCrimes
Old Navy Vet
The graph show a nationwide average. Due to redlining there are some regional differences.
If middle class folks don't vote out the Republicans you'll continue to get fucked.
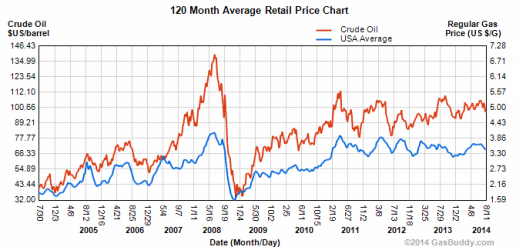
I'm aware of the chart's data averaging, and that the data of the period covered is non-representative of the current realities on both ends. Regional or PAD Districts disparities are subsumed in the averaging process, are they not? The link to the chart I added displays the past 10 years average gas prices laid over the spot market price for crude for the same period. If that didn't get your attention either you didn't understand the significance of comparing the two over the same period, or you never bothered to open it.
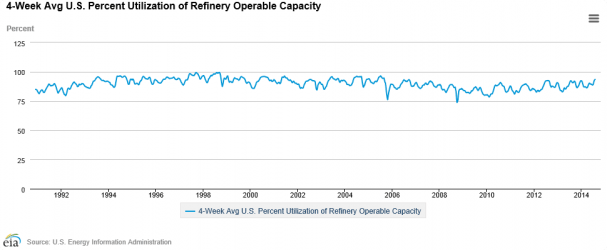
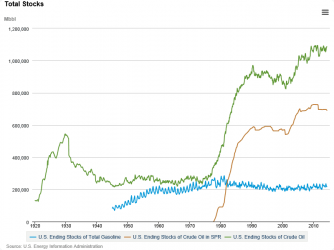
I'll add that chart plus two others in another manner (thumbs) so they can't be overlooked; one displaying refinery utilization and the other displaying the ending stocks of all crude oil, crude oil in the Strategic Petroleum Reserve (SPR) and gasoline. (click on each to enlarge in new window)
By comparing their relationships, one to the other, one can discern some interesting suggestive information. Perhaps collective manipulation of the market supply and demand dynamic. OH the nabirds are going to throw a fit!
Forget about the GOP sailing off into the sunset. That's not going to happen, no way, no how. They have a firm grip on their faction's psyche's and are riding the crest of that wave until it breaks on the reef of reason and time.
Apples and oranges. One has to do with oil market and how its prices fluctuate based upon supply and the other is about amount of available refined product.
Ahem!!!! ~~~~ So you're saying:
Graph 1. The crude spot market price isn't a major factor impacting the price of oil products such as gasoline? Doesn't that go against the press releases and the common wisdom of the last three decades?
Graph 2. The fluctuations in refinery utilization will have no impact on the price of crude based products such as gasoline? The ebbing utilization over the last 5-6 years over the same previous period of 5-6 years with a relatively constant level of potential production capacity does not impact the supply/demand dynamic?
Graph 3. The rising gap in the total monthly end stocks of crude over the relatively constant total motor gasoline monthly end stocks for the last two decades can be explained how? If the crude stocks rise, but refinery utilization trends downward, while the price of spot crude vacillates wildly and the price of motor gasoline continues to trend upward, wouldn't a reasonable person think there might be some direct as well as indirect correlation between those multiple factors?
I think those apples and oranges you talks about are a figment of your imagination!
EDIT: Added thumbs for reference.
Attachments
Last edited:

")