flacaltenn
Diamond Member
- Jun 9, 2011
- 67,573
- 22,962
Stratospheric methane has a broader range of concentrations, so the second graph has a different scale. Why is this a problem for you? As for the methane levels in Argentina, do you have specific evidence that termites are responsible there or are you simply throwing out a red herring? It could well be termites emitting the gas there. It could also be the fact that they've cut down millions of acres of forest and turned those lands into grazing lands for cattle.
The graph from nature is unfamiliar to me. So you have significant text top go along with it, or did you pull that our of a hat? Mind you, I know what it says, but I prefer to know the specific source and read what the author had in mind when he produced that graph. Got a link?
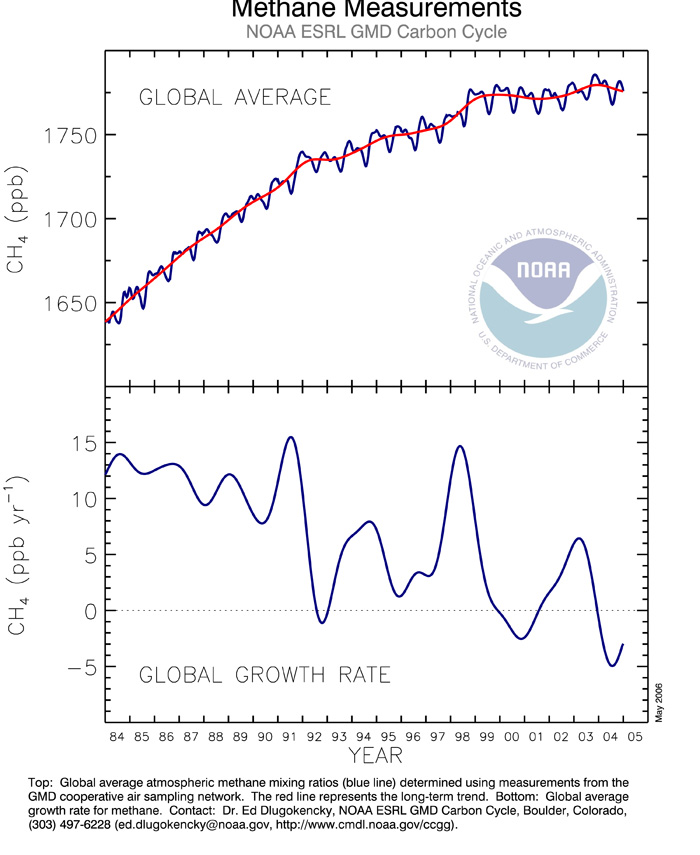
So you don't believe that the fact that atmospheric concentrations of one of the most potent greenhouse gases around increased from just below 1650 ppm to around 1750 ppm in just 20 years is a problem? Really? Why is that?
As for taking measurements at Mauna Loa, we've done so for decades. If there was a problem, we wouldn't be doing it. there Next.
")
Seriously? A geologist asking why Mauna Loa presents problems for taking CH4 measurements?? There is a at least a 15ppm differential between M.Loa and Global average.. Does this ring a bell??

I'll trace back the source of that Nature pix...
Why don't I see a problem?? Because the RATE of atmos methane has pretty much DECREASED for 20 yrs.. Didn't say it COULDN'T be a climate accelerant..
Except for after reading some of those references you cut last night -- I'm now MORE CONCERNED about SEISMIC events causing a huge release than I am about about 1.4degC rise in the "trigger"..