How do we Know Human are Causing Climate Change?

Humans made and emitted the CO2 that is warming the planet
Bull Shit Again..

View attachment 251314

Come on now Crick... where is your correlation? Why haven't we runaway before with levels far higher than today?

You've seen my correlation. You claimed it was a lie. However, you nor anyone else has provided one single fuckiing shred of evidence to back up that claim. While I can show that data from four different international organizations and tens of thousands of scientists who use it every day without a hint of a complaint. What the fuck have you got you stupid, lying asshole?

Still waiting for a response from Billy Bob with some evidence for his claim that NASA. NOAA, BEST, JWA, Hadley and NWS are all, in coordination, putting out falsified temperature data. And, if I were as stupid as Billy Bob and several other deniers here, I'd be demanding "proof".
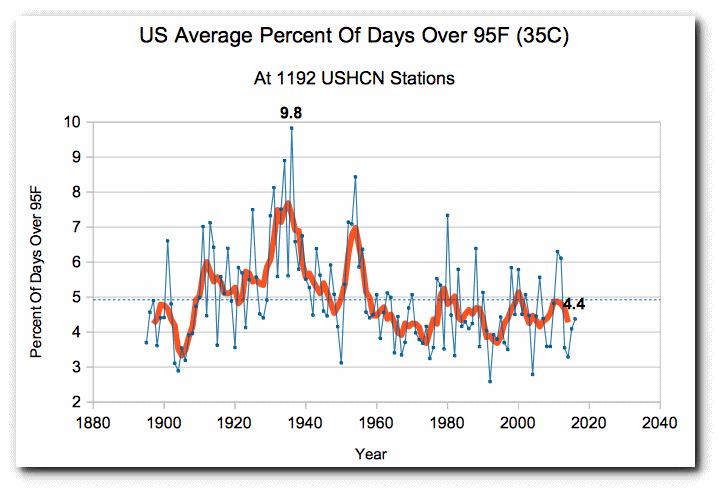
Screen-Shot-2016-12-27-at-4.37.50-AM.gif

And, JC, do you believe this is evidence - or even proof - that the global temperature datasets maintained by NASA, NOAA, BEST, Hadley and the rest are falsified? If so, you are going to have to explain how that works to me. The USHCN stations cover 1.6% of the planet's surface and every bit of it is in one hemisphere.
sure, because it voids the 1.6% that is inclusive in all of the reports you have ever posted in this forum. One piece fraud, the whole thing is fraud. You have heard of the rotten potato in a bag, right?
 
I think the bigger problem is that you seem to be "voiding" the 98.4% that make up the rest of the planet. That CRN data IS included in the global land and ocean calculations fool.
 
I think the bigger problem is that you seem to be "voiding" the 98.4% that make up the rest of the planet. That CRN data IS included in the global land and ocean calculations fool.
not at all. I'm pointing you to the fraud. you choose not to look isn't my problem. I don't care how much of bad graph is fraud, if any of it is fraud, the rest is contaminated.
 
Last edited:
You haven't shown ANYTHING to be fraudulent. You have shown yourself to be an ignorant fool.

I understand that you accept SSDD's contention that photons cannot move from cold to warm and that therefore there is not greenhouse effect. Is that a correct description of your position?
 
JC, the CRN data from the contiguous US does NOT indicate that the global data should have different values than it does. A quick example: 16 numbers: 8, 9, 6, 10, 7, 11, 9, 13, 8, 2, 8, 7, 9, 12, 12, 9. The average of those numbers is 8.75. There was a 2 in there. It was the lowest number. Does it somehow prove that the average of those numbers ISN'T 8.75? No. Neither does the highest number, the 13. And the contiguous US was not the only place on the planet that showed little warming. But other places, like the Arctic, showed large warming. The average of all that is what is seen in the global data from all the various sources.

If you want to show that those data have been falsified, you will have to do a great deal more than you have.
No I don’t
 
Humans made and emitted the CO2 that is warming the planet
Bull Shit Again..

View attachment 251314

Come on now Crick... where is your correlation? Why haven't we runaway before with levels far higher than today?

You've seen my correlation. You claimed it was a lie. However, you nor anyone else has provided one single fuckiing shred of evidence to back up that claim. While I can show that data from four different international organizations and tens of thousands of scientists who use it every day without a hint of a complaint. What the fuck have you got you stupid, lying asshole?

Still waiting for a response from Billy Bob with some evidence for his claim that NASA. NOAA, BEST, JWA, Hadley and NWS are all, in coordination, putting out falsified temperature data. And, if I were as stupid as Billy Bob and several other deniers here, I'd be demanding "proof".
Screen-Shot-2016-12-27-at-4.37.50-AM.gif

And, JC, do you believe this is evidence - or even proof - that the global temperature datasets maintained by NASA, NOAA, BEST, Hadley and the rest are falsified? If so, you are going to have to explain how that works to me. The USHCN stations cover 1.6% of the planet's surface and every bit of it is in one hemisphere.

I have provided regional temperature histories from all over the globe...when you look at regional temperatures, you see some cooling, a couple warming, and most show no statistically significant trend at all...the only place you see a global trend is in the highly manipulated, homogenized, and infilled global record. If "global" warming were happening, a warming trend would be visible in all, or nearly all regional records..

It isn't. Sorry skidmark, but once again, reality and the scientific method show how wrong you and your unsubstantiated beliefs are.
 
I think the bigger problem is that you seem to be "voiding" the 98.4% that make up the rest of the planet. That CRN data IS included in the global land and ocean calculations fool.

The larger problem is that you are ignoring the fact that when you look at regional temperature records, "global" warming simply doesn't show up.. If "global" warming were happening, then a warming signature would be showing up in at least most regional records...it doesn't. A global trend only shows up in the highly manipulated, homogenized, and infilled global record.


http://www.the-cryosphere.net/11/343/2017/tc-11-343-2017.pdf

Holocene-Cooling-Antarctica-Adelie-Land-Goursaud-17.jpg


http://www.clim-past-discuss.net/cp-2017-26/cp-2017-26.pdf

Holocene-Cooling-Alaska-Gulf-North-Pacific-Wilson-17.jpg


Holocene-Cooling-Alaska-Gulf-Wilson-17.jpg


Two centuries temperature variations over subtropical southeast China inferred from Pinus taiwanensis Hayata tree-ring width

Holocene-Cooling-China-SE-Cai-and-Liu-17.jpg


SAGE Journals: Your gateway to world-class journal research

Holocene-Cooling-Norwegian-Atlantic-Tegzes-17a.jpg
Holocene-Cooling-Norwegian-Atlantic-Tegzes-17.jpg


High sensitivity of North Iceland (Tröllaskagi) debris-free glaciers to climatic change from the ‘Little Ice Age’ to the present (PDF Download Available)

Holocene-Cooling-Iceland-Glaciers-Temps-Fernández-Fernández-17.jpg


http://www.clim-past.net/13/93/2017/cp-13-93-2017.pdf

Holocene-Cooling-Iberian-Range-Tejedor-17.jpg


http://cms.unige.ch/sciences/terre/news/articles/Guillet_etal_NGEO_2017.pdf

Holocene-Cooling-France-Grape-Harvest-Date-Guillet-17.jpg


http://www.clim-past.net/13/1/2017/cp-13-1-2017.pdf

Holocene-Cooling-Turkey-Köse-17.jpg
Holocene-Cooling-Turkey-Europe-Köse-17.jpg


https://www.researchgate.net/public..._Siderastrea_siderea_from_the_Florida_Straits

Holocene-Cooling-Florida-U.S.-SSTs-Flannery-17.jpg


http://www.sciencedirect.com/science/article/pii/S0277379116305479

Holocene-Cooling-Antarctica-Circle-Mayewski-17-1.jpg


https://link.springer.com/article/10.1007/s00382-016-3478-8

Holocene-Cooling-Scotland-Rydval-17.jpg


http://www.sciencedirect.com/science/article/pii/S0031018216303054

Holocene-Cooling-North-Atlantic-SSTs-Reynolds-17_.jpg


http://www.sciencedirect.com/science/article/pii/S0277379116304802

Holocene-Cooling-Western-Pacific-Warm-Pool-OHC-2.jpg

Holocene-Cooling-Northeastern-Atlantic-OHC-Rosenthal-17.jpg

Holocene-Cooling-Equatorial-Atlantic-SST-Rosenthal-17.jpg


http://www.sciencedirect.com/science/article/pii/S027737911630381X

Holocene-Cooling-North-China-Li-17.jpg


Continued...
 
Present-Arrow-Left.jpg


SAGE Journals: Your gateway to world-class journal research


Holocene-Cooling-Tibet-Dagze-Dong-17.jpg


Changes in temperature and water depth of a small mountain lake during the past 3000 years in Central Kamchatka reflected by a chironomid record

Holocene-Cooling-Russia-East-Nazarova-2017.jpg


http://www.nature.com/ngeo/journal/v10/n3/full/ngeo2891.html

Holocene-Cooling-Mediterranean-Samartin-17.jpg


SAGE Journals: Your gateway to world-class journal research

Holocene-Cooling-Macedonia-Greece-Thienemann-17.jpg


Temperature variations since 1750 CE inferred from an alpine lake in the southeastern margin of the Tibetan Plateau

Holocene-Cooling-Tibetan-Plateau-Li-17.jpg


https://www.researchgate.net/public...enland_from_the_first_regional_diatom_dataset

Holocene-Cooling-Greenland-East-Krawczyk-17-.jpg

Holocene-Cooling-Greenland-Arctic-Krawczyk-17.jpg


Quantitative reconstruction of temperature at a Jōmon site in the Incipient Jōmon Period in northern Japan and its implications for the production of early pottery and stone arrowheads

Holocene-Cooling-Japan-Kawahata-17.jpg


Climate variability in the past ∼19,000 yr in NE Tibetan Plateau inferred from biomarker and stable isotope records of Lake Donggi Cona

Holocene-Cooling-Tibetan-Plateau-Saini-17.jpg


https://www.researchgate.net/public...nce_from_the_mid-_to_outer_Great_Barrier_Reef

Holocene-Cooling-Tropical-Western-Pacific-SST-Dechnik-17-768x541.jpg


Holocene hydrological and sea surface temperature changes in the northern coast of the South China Sea

Holocene-Cooling-South-China-Sea-Wu-2017.jpg


Oscillations in the Indian summer monsoon during the Holocene inferred from a stable isotope record from pyrogenic carbon from Lake Chenghai, southwest China

Holocene-Cooling-China-SW-Sun-17.jpg


https://www.researchgate.net/public...mental_change_for_southern_Pacific_Costa_Rica

Holocene-Cooling-Costa-Rica-South-Pacific-Wu-17.jpg


Solar and tropical ocean forcing of late-Holocene climate change in coastal East Asia

Holocene-Cooling-Western-Tropical-Pacific-Park-17.jpg


Just for fun, here are a few more...


http://www.sciencedirect.com/science/article/pii/S0277379116306217


SAGE Journals: Your gateway to world-class journal research


http://www.sciencedirect.com/science/article/pii/S0031018217300500


https://www.researchgate.net/public...olocene_and_its_sensitivity_to_climate_change
 
JC, the CRN data from the contiguous US does NOT indicate that the global data should have different values than it does. A quick example: 16 numbers: 8, 9, 6, 10, 7, 11, 9, 13, 8, 2, 8, 7, 9, 12, 12, 9. The average of those numbers is 8.75. There was a 2 in there. It was the lowest number. Does it somehow prove that the average of those numbers ISN'T 8.75? No. Neither does the highest number, the 13. And the contiguous US was not the only place on the planet that showed little warming. But other places, like the Arctic, showed large warming. The average of all that is what is seen in the global data from all the various sources.

If you want to show that those data have been falsified, you will have to do a great deal more than you have.

Of course it does....if you break the global record down into regions, it shows the US to be warming...the fact is that the US is cooling...is there a rational reason to believe that if the heavily manipulated global record shows warming in the US that isn't happening, that it is also showing warming in the rest of the world that isn't happening.

Then there is the fact that when you look at actual regional temperature records, you don't see a general warming trend across the globe...See the graphs provided above...there is no general warming trend showing up in all, or even most regional records. A general warming trend only shows up in the heavily manipulated, homogenized and infilled global record...

There is evidence of massive data manipulation and fraud on a colossal scale...
 
JC, the CRN data from the contiguous US does NOT indicate that the global data should have different values than it does. A quick example: 16 numbers: 8, 9, 6, 10, 7, 11, 9, 13, 8, 2, 8, 7, 9, 12, 12, 9. The average of those numbers is 8.75. There was a 2 in there. It was the lowest number. Does it somehow prove that the average of those numbers ISN'T 8.75? No. Neither does the highest number, the 13. And the contiguous US was not the only place on the planet that showed little warming. But other places, like the Arctic, showed large warming. The average of all that is what is seen in the global data from all the various sources.

If you want to show that those data have been falsified, you will have to do a great deal more than you have.
No I don’t

Please explain then why you think the contiguous US temperatures falsify the global data. Do the greater warming data from the Arctic prove that the global data is falsely colder?
 
JC, the CRN data from the contiguous US does NOT indicate that the global data should have different values than it does. A quick example: 16 numbers: 8, 9, 6, 10, 7, 11, 9, 13, 8, 2, 8, 7, 9, 12, 12, 9. The average of those numbers is 8.75. There was a 2 in there. It was the lowest number. Does it somehow prove that the average of those numbers ISN'T 8.75? No. Neither does the highest number, the 13. And the contiguous US was not the only place on the planet that showed little warming. But other places, like the Arctic, showed large warming. The average of all that is what is seen in the global data from all the various sources.

If you want to show that those data have been falsified, you will have to do a great deal more than you have.

Of course it does....if you break the global record down into regions, it shows the US to be warming...the fact is that the US is cooling...is there a rational reason to believe that if the heavily manipulated global record shows warming in the US that isn't happening, that it is also showing warming in the rest of the world that isn't happening.

Then there is the fact that when you look at actual regional temperature records, you don't see a general warming trend across the globe...See the graphs provided above...there is no general warming trend showing up in all, or even most regional records. A general warming trend only shows up in the heavily manipulated, homogenized and infilled global record...

There is evidence of massive data manipulation and fraud on a colossal scale...
I gave him the local temps for the month of February for Atlanta and they did not match his graph. I don't need to do anything else as it shows a pattern that the rest of that map most likely is wrong. I'd be happy to go pull the month of February for any other local city in the US and see if it matches, but he needs to tell me the city. I'm done ricocheting around the board for the punk..
 
JC, the CRN data from the contiguous US does NOT indicate that the global data should have different values than it does. A quick example: 16 numbers: 8, 9, 6, 10, 7, 11, 9, 13, 8, 2, 8, 7, 9, 12, 12, 9. The average of those numbers is 8.75. There was a 2 in there. It was the lowest number. Does it somehow prove that the average of those numbers ISN'T 8.75? No. Neither does the highest number, the 13. And the contiguous US was not the only place on the planet that showed little warming. But other places, like the Arctic, showed large warming. The average of all that is what is seen in the global data from all the various sources.

If you want to show that those data have been falsified, you will have to do a great deal more than you have.
No I don’t

Please explain then why you think the contiguous US temperatures falsify the global data. Do the greater warming data from the Arctic prove that the global data is falsely colder?
because, I gave you the temps from the local Atlanta area for the month of February and they didn't match your map. It is simple.
 
How do we Know Human are Causing Climate Change?

Because the climate never changed before we started using fossil fuels?
There is no such thing as a 'global climate'... Earth has MANY climates. Climate is typically defined along the lines of 'weather in an area over a long period of time'. Madison, WI has a climate... Seattle, WA has a climate... Earth does NOT have a climate...

We never used fossils for fuel. Fossils do not burn very well.


Define 'climate change' in a non-circular manner...
 
I looked through them all, and there is nothing there that could be construed in any way to be observed, measured evidence that supports the AGW hypothesis over natural variability....as with all warmest propaganda, there are some observations, and great big honking, handwaving hysterical assumptions hung on those observations...nothing like actual evidence to support the claims......you have to be willing to simply believe...

Of course if you believe there is observed, measured evidence there that supports the AGW hypothesis over natural variability, by all means cut and paste it here, or point it out and I will be happy to go look.

All of which still fails to contain:
  • Predictability
  • Quantifiability
  • Fasifiablility
  • A static control
  • Any baseline proposal of what the "ideal" temperature should be

And the warmer Bozos still claim that they're proponents of science.
ABSOLUTELY correct... Nice to see someone who actually understands science instead of spouting the Church of Global Warming religious dogma...

These twits outright deny not only science, but logic and mathematics as well.
 
I looked through them all, and there is nothing there that could be construed in any way to be observed, measured evidence that supports the AGW hypothesis over natural variability....as with all warmest propaganda, there are some observations, and great big honking, handwaving hysterical assumptions hung on those observations...nothing like actual evidence to support the claims......you have to be willing to simply believe...

Of course if you believe there is observed, measured evidence there that supports the AGW hypothesis over natural variability, by all means cut and paste it here, or point it out and I will be happy to go look.

All of which still fails to contain:
  • Predictability
  • Quantifiability
  • Fasifiablility
  • A static control
  • Any baseline proposal of what the "ideal" temperature should be

And the warmer Bozos still claim that they're proponents of science.

Speaking of quantifiability....did you know that to date, there is not one single published paper in which the hypothetical warming caused by our activities has been empirically, measured, quantified, and blamed on so called greenhouse gasses...not one single published paper.

And every day one of the warmer wackos tells us that the science is settled.
Yup, those twits do not understand what science is. All science is is a set of falsifiable theories. It is never 'settled', as it does not make use of proofs. It is not a consensus, peer review, a university course, a professor, an elite voting bloc, nor a casino (among other things these twits want to make science into).

There is no such thing as a 'greenhouse gas'. The 'greenhouse gas model' denies the laws of thermodynamics as well as the stefan boltzmann law. We have no idea what the 'global temperature' is, since we do not have NEARLY enough thermometers to even BEGIN such a statistical analysis, and the thermometers we DO have are NOT uniformly spaced NOR are they simultaneously read by the same observer.

These twits haven't even defined the terminology in an acceptable manner. 'Climate Change' is a circularly-defined buzzword; it is meaningless; it is a void argument.
 
My favorite word for Climate Change is "IF".. that right there is the game changer..

    • Could
    • May
    • Might
Then you must have been Partisanly Blind to not see the most important and common word..
"KNOW."
`
So how many years left do we have before we reach the point of no return again? 12 as AOC says, or 100, or 1000? Or you just dont "KNOW".
Notice how all the Dems are starting to pick up on this "12 years left" religious dogma?? It gets fed to them by the 'powers that be' behind the curtains...

They have no data, they deny currently standing laws of science, they deny logic, they deny mathematics, and they haven't even adequately defined their term. What IS "climate change"? Remember, definitions CAN NOT be circular...
 
I looked through them all, and there is nothing there that could be construed in any way to be observed, measured evidence that supports the AGW hypothesis over natural variability....as with all warmest propaganda, there are some observations, and great big honking, handwaving hysterical assumptions hung on those observations...nothing like actual evidence to support the claims......you have to be willing to simply believe...

Of course if you believe there is observed, measured evidence there that supports the AGW hypothesis over natural variability, by all means cut and paste it here, or point it out and I will be happy to go look.

All of which still fails to contain:
  • Predictability
  • Quantifiability
  • Fasifiablility
  • A static control
  • Any baseline proposal of what the "ideal" temperature should be

And the warmer Bozos still claim that they're proponents of science.

Speaking of quantifiability....did you know that to date, there is not one single published paper in which the hypothetical warming caused by our activities has been empirically, measured, quantified, and blamed on so called greenhouse gasses...not one single published paper.

And every day one of the warmer wackos tells us that the science is settled.
Yup, those twits do not understand what science is. All science is is a set of falsifiable theories. It is never 'settled', as it does not make use of proofs. It is not a consensus, peer review, a university course, a professor, an elite voting bloc, nor a casino (among other things these twits want to make science into).

There is no such thing as a 'greenhouse gas'. The 'greenhouse gas model' denies the laws of thermodynamics as well as the stefan boltzmann law. We have no idea what the 'global temperature' is, since we do not have NEARLY enough thermometers to even BEGIN such a statistical analysis, and the thermometers we DO have are NOT uniformly spaced NOR are they simultaneously read by the same observer.

These twits haven't even defined the terminology in an acceptable manner. 'Climate Change' is a circularly-defined buzzword; it is meaningless; it is a void argument.

There is no such thing as a 'greenhouse gas'. The 'greenhouse gas model' denies the laws of thermodynamics as well as the stefan boltzmann law.

Sounds interesting. Can you elaborate?
 

Forum List

Back
Top