Job Creation, Stock Market, Corporate Profits..Obama Beats Bush.

And, by the way, the recession that Ronald Reagan faced was just as bad as, if not worse than, the recession that Obama faced. Yet, by this same point in Reagan's presidency, there had been a substantial increase in net job growth, much better than what we've seen under Obama; GDP growth was double what it is now; and median family income had gone up, not down.

Grover Norquist: Reagan vs. Obama: The record - Conservative News

http://www.forbes.com/sites/peterfe...reaganomics-vs-obamanomics-facts-and-figures/

Well no it wasn't.

All the heavy lifting was done by Paul Volcker. They created that recession deliberately to deal with the stagflation.

It worked like gangbusters.

Wow so why doesn't Obama do that? I thought he was smart or something

That ship has sailed. Any attempt to increase rates would just destroy the economy and destroy all that job creation Sallow thinks is so great (despite all of these people are employed in the wrong areas of the economy).

The country will just have to settle for a devalued dollar instead.
 
6.5M people have quit the labor force since Obama took office. The only reason unemployment has dropped is due to the drop in the Labor Force Participation Rate.

The corollary is that we now have a huge number of people on disability, many for "emotional" issues.

Labor Force Jan 2009 = 154,232,000
Labor Force April 2013 = 155,238,000

Now, by my math...155,238,000-154,232,000 = 1,006,000 But youre saying it's -6,500,000? You're going to have to explain how that works.
65.7 2009 when obama took office now the Labor Force Participation Rate is 63.3 your numbers don't add up to healthy growth and appear to be factitious
latest_numbers_LNS11300000_2003_2013_all_period_M04_data.gif
 
[/COLOR][/B]
True Republican thinking. Punish the workers.........reward the so called "employers" (the rich) and all will be well. It worked so well for us when Bush did that for 8 years didn't? Tell me this, which regulations do you want gone? Safety maybe? Environmental? Cutting taxes by Bush is what got us into this mess.

The days of screwing the workers and their families are over Conservatives. Why do you think so many young people hate the Tea Party? Its that tea party attitude of employer first. You had your fun. Time to let your wage slaves go.

I seriously doubt many young people have given much thought onto the tea party movement. In fact, I'm sure they are discovering just how well Obama has been handling this economy.

A new poll conducted by global management firm Accenture finds that 41% of U.S. workers who graduated from college in the last two years are underemployed and working in jobs that did not require a college degree.

16% of college students who will graduate this year had already landed a job.

Worse, 32% of the 2011 and 2012 college graduates who are employed make $25,000 or less in annual salary.

Low earnings like that make climbing out of student debt difficult. Indeed, 34% of those surveyed said they have student loan debt of $30,000 or less and 17% owed between $30,000 and $50,000.

32% of the students who will graduate in 2013 say they plan to move back home after graduation. Indeed, 44% of those who graduated college in 2011 and 2012 say they currently live at home with their parents.

Poll: 41% of College Graduates Underemployed

That's what letting Republicans driven by greed will do. Took all our jobs over seas but people like you only see OBAMA! What about all the shit your heros caused. Nah, if just oh just if Obama was not the President. If those kids wont to have a chance at anything but a debt filled treadmill existence they had better get Republicans gone and fast.


Get back to me when you figure out who had complete control of the legislative branch from 2006 - 2010.
 
6.5M people have quit the labor force since Obama took office. The only reason unemployment has dropped is due to the drop in the Labor Force Participation Rate.

The corollary is that we now have a huge number of people on disability, many for "emotional" issues.

Labor Force Jan 2009 = 154,232,000
Labor Force April 2013 = 155,238,000

Now, by my math...155,238,000-154,232,000 = 1,006,000 But youre saying it's -6,500,000? You're going to have to explain how that works.

You do realise that the Civilian Labour Force and the people who are leaving it (known as 'Not In Labour Force') are different, correct?

fredgraph.png


fredgraph.png
 
Last edited:
I seriously doubt many young people have given much thought onto the tea party movement. In fact, I'm sure they are discovering just how well Obama has been handling this economy.

That's what letting Republicans driven by greed will do. Took all our jobs over seas but people like you only see OBAMA! What about all the shit your heros caused. Nah, if just oh just if Obama was not the President. If those kids wont to have a chance at anything but a debt filled treadmill existence they had better get Republicans gone and fast.


Get back to me when you figure out who had complete control of the legislative branch from 2006 - 2010.
That meant nothing. Bush found his veto pen for the first time in his Presidency. Once Obama came lots of good things got done. Bush left a huge mess and then the Bush supporting Tea Party with racism as its rocket fuel pushed a bunch of crazies in.

If that did not happen in 2010 this Country would be alive with employment and well being......stupid rightwing Tea Party
 
6.5M people have quit the labor force since Obama took office. The only reason unemployment has dropped is due to the drop in the Labor Force Participation Rate.

The corollary is that we now have a huge number of people on disability, many for "emotional" issues.

Labor Force Jan 2009 = 154,232,000
Labor Force April 2013 = 155,238,000

Now, by my math...155,238,000-154,232,000 = 1,006,000 But youre saying it's -6,500,000? You're going to have to explain how that works.
65.7 2009 when obama took office now the Labor Force Participation Rate is 63.3 your numbers don't add up to healthy growth and appear to be factitious
latest_numbers_LNS11300000_2003_2013_all_period_M04_data.gif

Learn the difference between level and rate. The claim was that the Labor Force had dropped by 6.5 million, when in fact it has grown by 1 million. Now...the population has grown by 10.4 million, so the Labor Force has not grown by the same percentage as the population (0.7% compared to 4.4%) so the LF participation rate has dropped.

Note that I never said the growth was healthy or at a good level, but it is still growth.

Oh, and note that while the number of people not in the labor force has gone up 9.4 million, the number of people not in the labor force who don't want a job has gone up 8.7 million.
 
6.5M people have quit the labor force since Obama took office. The only reason unemployment has dropped is due to the drop in the Labor Force Participation Rate.

The corollary is that we now have a huge number of people on disability, many for "emotional" issues.

Labor Force Jan 2009 = 154,232,000
Labor Force April 2013 = 155,238,000

Now, by my math...155,238,000-154,232,000 = 1,006,000 But youre saying it's -6,500,000? You're going to have to explain how that works.

You do realise that the Civilian Labour Force and the people who are leaving it (known as 'Not In Labour Force') are different, correct?

fredgraph.png


fredgraph.png

Apparently you do not realize that Not in the Labor Force does NOT mean "left the labor force."

If you left the labor force, you must have once been in it. You can be Not in the Labor Force without ever having been in the labor force.

If you look at Labor force status flows by sex, current month you'll see that in April, 286,000 people entered the population as Not in the Labor Force (seasonally adjusted, "other inflows" on the vertical axis, "not in the Labor force" on the horizontal)
 
Last edited:
Labor Force Jan 2009 = 154,232,000
Labor Force April 2013 = 155,238,000

Now, by my math...155,238,000-154,232,000 = 1,006,000 But youre saying it's -6,500,000? You're going to have to explain how that works.
65.7 2009 when obama took office now the Labor Force Participation Rate is 63.3 your numbers don't add up to healthy growth and appear to be factitious
latest_numbers_LNS11300000_2003_2013_all_period_M04_data.gif

Learn the difference between level and rate. The claim was that the Labor Force had dropped by 6.5 million, when in fact it has grown by 1 million. Now...the population has grown by 10.4 million, so the Labor Force has not grown by the same percentage as the population (0.7% compared to 4.4%) so the LF participation rate has dropped.

Note that I never said the growth was healthy or at a good level, but it is still growth.

Oh, and note that while the number of people not in the labor force has gone up 9.4 million, the number of people not in the labor force who don't want a job has gone up 8.7 million.

The labor force numbers HAVE NOT WENT UP try again.
 
Labor Force Jan 2009 = 154,232,000
Labor Force April 2013 = 155,238,000

Now, by my math...155,238,000-154,232,000 = 1,006,000 But youre saying it's -6,500,000? You're going to have to explain how that works.

You do realise that the Civilian Labour Force and the people who are leaving it (known as 'Not In Labour Force') are different, correct?

fredgraph.png


fredgraph.png

Apparently you do not realize that Not in the Labor Force does NOT mean "left the labor force."

It's the same thing. You're just really not well avast in research to understand that FRED and the BLS categorises it the same. When a person leaves the civilian labour force and is not looking for work for more than 30 days, they become part of the marginally attached. This can either be students, retired, homemarkers, etc. When the amount of people leave the labour force, this category increases. The people leaving the labour force can still increase while people are leaving, but more often than not, more people have been leaving.

If you left the labor force, you must have once been in it. You can be Not in the Labor Force without ever having been in the labor force.

If you look at Labor force status flows by sex, current month you'll see that in April, 286,000 people entered the population as Not in the Labor Force ("other inflows" seasonally adjusted)

You're reading your own data incorrectly. All you are looking at are the makeups of who consist of the 'Not In labour Force' category. Also you have somehow confused yourself into believing that 'other inflows' are people who are entering this category. It helps to actually look at this in a monthly basis so you don't confuse yourself. The people in the 'Not In Labour Force' category decreased for the month of April, not increased. Perhaps looking at BLS statistics is too difficult for you. Here is something easier for you to understand.

People Not in Labor Force (Monthly)

Also, I combined and modified the two charts I have shown earlier to help you get a better understanding of what you are suppose to be looking at.

fredgraph.png

When you actually put it in context of the labour force, it actually makes more sense. Notice the unemployment rate dropped in April? It was one of the very few months in the economy where employment grew and the labour force actually grew, not shrink. Not only did people not leave the labour force, the ones who were marginally attached actually re-entered the labour force.

It helps to have a better understanding of the data, before blindly looking at just anything as a sign of a 'growing' economy or 'improvement.'
 
Last edited:
Apparently you do not realize that Not in the Labor Force does NOT mean "left the labor force."
When a person leaves the civilian labour force and is not looking for work for more than 30 days, they become part of the marginally attached.
This can either be students, retired, homemarkers, etc.
Not quite.

Marginally Attached is defined as: Did no work during the reference week, wants to work, could have started a job during the reference week, actively looked for work in the previous 12 months but not the 4 weeks ending in the reference week. Someone who was in the Labor Force as employed, is fired/quits/retires/etc and does not look for work will not be classified as marginally attached because they didn't look for work in the previous year.

Not in the Labor Force is far more than Marginally Attached, so I'm not even sure why you brought them up.

When the amount of people leave the labour force, this category increases. The people leaving the labour force can still increase while people are entering, but more often than not, more people have been leaving.
You do realize that the changes are NET changes, right?

If you left the labor force, you must have once been in it. You can be Not in the Labor Force without ever having been in the labor force.

If you look at Labor force status flows by sex, current month you'll see that in April, 286,000 people entered the population as Not in the Labor Force ("other inflows" seasonally adjusted)

You're reading your own data incorrectly. All you are looking at are the makeups of who consist of the 'Not In labour Force' category.
No, i'm not. The link is for an experimental series of Labor Force FLOWS. It shows the GROSS changes in each category. The vertical axis shows the status in the previous month, and the horizontal shows the status in the current month. So looking at the Seasonally adjusted data, you'll see that there were 143,286,000 people who were employed in March, 137,312,000 still employed in April, 2,008,000 who became Unemployed in April, 3,941,000 who left the labor force and 24,000 who left the population.

Perhaps you should do some research before commenting...here's the page to read: Research series on labor force status flows from the Current Population Survey

Also you have somehow confused yourself into believing that 'other inflows' are people who are entering this category.
No, that's precisely what it means.

The people in the 'Not In Labour Force' category decreased for the month of April, not increased.
You are correct, you just don't know how to read the chart. Look at Not in the Labor Force on the on the horizontal...you'll see that there were 3,941,000 who were employed in March, Not in the Labor Force in April, there were 2,469,000 who were unemployed in March, Not in the Labor Force in April, 83,240,000 who stayed Not in the Labor Force and 286,000 who entered as Not in the Labor Force. That is 6,696,000 people who entered the Not in the Labor Force Category.

At the same time, looking at Not in the Labor Force on the vertical axis, in March to April, 3,912,000 went from Not in the Labor Force to Employed, 2,625,000 went from Not in the Labor Force to Unemployed, and 191,000 who left the population. So that's 6,728,000 who left the category of Not in the Labor Force. 6,696,000 - 6,728,000 = -32,000 which is the NET change in the Not in the Labor Force Category.


Perhaps looking at BLS statistics is too difficult for you.
Perhaps you should actually learn what you're talking about before coming in condescending to someone who knows this stuff inside and out because he does it for a living.
 
Last edited:
Not quite.

Marginally Attached is defined as: Did no work during the reference week, wants to work, could have started a job during the reference week, actively looked for work in the previous 12 months but not the 4 weeks ending in the reference week. Someone who was in the Labor Force as employed, is fired/quits/retires/etc and does not look for work will not be classified as marginally attached because they didn't look for work in the previous year.

Not in the Labor Force is far more than Marginally Attached, so I'm not even sure why you brought them up.

The examples I have given you are people who are still marginally attached in some way, shape or form, but still is not part of the labour force. All Not in the Labour Force means is that there are 16 years old and over who are not classified as members of the labor force. Either way, you claimed that Not in the Labour Force is not the same as Left the Labour Force. Which is not exactly true. In fact, it's not true at all.

No, that's precisely what it means.

All 'other inflows' is determining the status of which individuals originated from in the labour force. They're not people entering the population as not in labour force. It could be regarding immigrants and people who are just turning 16, but this is not the bulk of this category. Your own source shows this.

The labor force flows can provide information from different perspectives. The examples above focused on examining the data in terms of the current month, that is, from which labor force status individuals came, often referred to as inflows. However, assessments also can focus on what happens to persons in a particular labor force category, such as the flow of individuals out of unemployment. This latter type of assessment (using total unemployment as the base) sheds light concerning the likelihood of individuals leaving their current state of unemployment and finding employment, remaining unemployed, or leaving the labor force.

You are correct, you just don't know how to read the chart. Look at Not in the Labor Force on the on the horizontal...you'll see that there were 3,941,000 who were employed in March, Not in the Labor Force in April, there were 2,469,000 who were unemployed in March, Not in the Labor Force in April, 83,240,000 who stayed Not in the Labor Force and 286,000 who entered as Not in the Labor Force. That is 6,696,000 people who entered the Not in the Labor Force Category.

At the same time, looking at Not in the Labor Force on the vertical axis, in March to April, 3,912,000 went from Not in the Labor Force to Employed, 2,625,000 went from Not in the Labor Force to Unemployed, and 191,000 who left the population. So that's 6,728,000 who left the category of Not in the Labor Force. 6,696,000 - 6,728,000 = -32,000 which is the NET change in the Not in the Labor Force Category.

That 32,000 is a net loss, not a get gain. Even still, 286,000 for 'other inflows' has is a totally different number than the other inflows of 286,000. This really doesn't have much to do with the population.

Perhaps you should actually learn what you're talking about before coming in condescending to someone who knows this stuff inside and out because he does it for a living.

Your anecdotal unknown profession doesn't convince anyone you are credible. Even still, you don't seem to be very good at it, whatever it is that you may or may not do...
 
Last edited:
To get some idea how weak Obama's recovery has been, let's consider how the economy was doing 48 months after Reagan's recovery began. Obama's recovery began in June 2009, 48 months ago. Reagan's recovery began in January 1983. 48 months after Reagan's recovery the unemployment rate had dropped to 7.0%, and median family income had risen by over $1,000. If we're lucky, 48 months after Obama's recovery began, the unemployment rate will be 7.4% (it was 7.5% in April), and median family income has dropped by over $4,000 since Obama took office.
 
And, by the way, the recession that Ronald Reagan faced was just as bad as, if not worse than, the recession that Obama faced. Yet, by this same point in Reagan's presidency, there had been a substantial increase in net job growth, much better than what we've seen under Obama; GDP growth was double what it is now; and median family income had gone up, not down.

Grover Norquist: Reagan vs. Obama: The record - Conservative News

http://www.forbes.com/sites/peterfe...reaganomics-vs-obamanomics-facts-and-figures/

Well no it wasn't.

All the heavy lifting was done by Paul Volcker. They created that recession deliberately to deal with the stagflation.

It worked like gangbusters.

Wow so why doesn't Obama do that? I thought he was smart or something

Stagflation was a problem?

Really CF?

Seriously?

Do you understand what Stagflation was?
 
That's what letting Republicans driven by greed will do. Took all our jobs over seas but people like you only see OBAMA! What about all the shit your heros caused. Nah, if just oh just if Obama was not the President. If those kids wont to have a chance at anything but a debt filled treadmill existence they had better get Republicans gone and fast.


Get back to me when you figure out who had complete control of the legislative branch from 2006 - 2010.
That meant nothing. Bush found his veto pen for the first time in his Presidency. Once Obama came lots of good things got done. Bush left a huge mess and then the Bush supporting Tea Party with racism as its rocket fuel pushed a bunch of crazies in.

If that did not happen in 2010 this Country would be alive with employment and well being......stupid rightwing Tea Party

If the GOP hadn't taken back the Congress in 2010 the next item on Barack Obama's "wish list" was Cap & Trade legislation...something that would have most likely cost HUGE numbers of jobs. He was also pushing new EPA regulations on green house gas emissions that he backed off on after the beating he took in the mid-terms. Letting the EPA enforce those regs would have driven up costs for businesses across the board. The "stupid rightwing Tea Party" as you've labeled them, actually prevented Barry and his little minions from REALLY screwing up the economy.
 
The examples I have given you are people who are still marginally attached in some way, shape or form, but still is not part of the labour force.
Yes, I quite clearly showed I understand the definition, I just don't understand why you brought up marginally attached at all.

All Not in the Labour Force means is that there are 16 years old and over who are not classified as members of the labor force. Either way, you claimed that Not in the Labour Force is not the same as Left the Labour Force. Which is not exactly true. In fact, it's not true at all.
You're contradicting yourself. It does only means those (in the adult civilian non-institutional population) who are not in the Labor Force. But you're also claiming it only means those who were once in the Labor Force and left.

A 15 year old is not in the population. Someone living in Canada is not in the population. The 15 year old turns 16 and is now in the population. The Canaian marries an American and moves to the States. Neither is working nor looking for work. They are Not in the Labor Force and never have been. So how are you claiming they left the Labor Force?

All 'other inflows' is determining the status of which individuals originated from in the labour force.
Oh, what other status besides employed or unemployed are you imagining? The population is entirely made up of employed, unemployed (together they're the Labor Force) an not in the Labor Force. So other inflows means from outside the population and other outflows means leaving the population.

They're not people entering the population as not in labour force. It could be regarding immigrants and people who are just turning 16, but this is not the bulk of this category. Your own source shows this.
no It doesn't. Again, the Labor Force is employed plus unemployed, so other means, well, other.

You are correct, you just don't know how to read the chart. Look at Not in the Labor Force on the on the horizontal...you'll see that there were 3,941,000 who were employed in March, Not in the Labor Force in April, there were 2,469,000 who were unemployed in March, Not in the Labor Force in April, 83,240,000 who stayed Not in the Labor Force and 286,000 who entered as Not in the Labor Force. That is 6,696,000 people who entered the Not in the Labor Force Category.

At the same time, looking at Not in the Labor Force on the vertical axis, in March to April, 3,912,000 went from Not in the Labor Force to Employed, 2,625,000 went from Not in the Labor Force to Unemployed, and 191,000 who left the population. So that's 6,728,000 who left the category of Not in the Labor Force. 6,696,000 - 6,728,000 = -32,000 which is the NET change in the Not in the Labor Force Category.

That 32,000 is a net loss, not a get gain.
Nobody said it was a net gain.

Even still, 286,000 for 'other inflows' has is a totally different number than the other inflows of 286,000.
that makes no sense.

Tis really doesn't have much to do with the population.
Oh? And where else do you think additions and subtraction to the population are covered in the flows?
 
Last edited:
"Delusional" would be a better description. These are lame excuses for Obama's miserable economic record.

First of all, if there are 10,000 people retiring every day, this should open up thousands of jobs every day as retirees leave those jobs vacant, so unemployment should not still be over 7%. As many experts have noted, the real unemployment percentage is probably at least 12%.

Furthermore, more than 150,000 per month are seeking to enter the job market, more than any other time in our history since our population is at an all-time high. So the number of jobless people should be lower, not higher, if the economy were performing even halfway well.

Only those who choose to delude themselves into thinking the economy is doing well can't see from the economic data that this is the weakest "recovery" in decades, if not in our history. The last time our GDP grew so slowly for a 4-year period was the Great Depression.

Just pull up the BLS employment report for Obama's first month in office and then pull up the most recent BLS report, and you'll see that the number of jobless people has gone UP, not down, since Obama took office. In terms of net jobs created, that number is a fraction of the fictional "millions" figure floated by Obama apologists.

Other aspects of Obama's poor economic record:

* Bank failures continue at near-recession levels. There have already been 15 bank failures this year alone. How bad is that? Well, there were 3 bank failures for the entire year of 2007. Last year, 2012, there were 51 bank failures. But you haven't heard about this fact on MSDNC (aka MSNBC), CNN, or the nightly news programs of ABC, NBC, and CBS. If Bush were in office, you can bet you'd have heard all about it.

* The dollar has lost over 15% of its value since Obama took office.

* The number of discouraged workers is now higher than it was when Obama took office (835,000 vs. 734,000), and that's a pitiful statistic, since Obama took office when the economy was in free fall. You gonna blame that increase on the number of people retiring?

* Median family income has dropped by over $4,000 since Obama took office.

* Obama's Fed is now buying at least 50% of new U.S. debt, a truly insane, unsustainable policy that is helping to mask how badly the economy is really doing. As bad as the economic data look, they would look worse if the Fed weren't propping up the house of cards by buying our own new federal debt. How long do you suppose that can continue? Then what? And why is the Fed having to do this? Because Obama tripled the deficit and has piled up more debt in 4 years than Bush did in 8 years, and because of this fiscal insanity foreign nations have reduced their U.S. debt purchases.

And on and on we could go. The economy is doing so poorly because Obama did akmost everything wrong in handling the recession. Instead of easing the regulatory burden on employers, he vastly increased it. Instead of getting the federal budget under control, he blew a hole in it--a hole we haven't seen since the height of WW II (when of course we had no choice but to go in debt). Instead of cutting taxes across the board and especially easing the tax burden on employers, he raised taxes on employers, the very people he was expecting to hire more workers, while giving us a gimmicky temporary payroll tax cut that obviously did little to help the situation.


True Republican thinking. Punish the workers.........reward the so called "employers" (the rich) and all will be well. It worked so well for us when Bush did that for 8 years didn't? Tell me this, which regulations do you want gone? Safety maybe? Environmental? Cutting taxes by Bush is what got us into this mess.

We got into this mess by letting people keep more of their paychecks? The Bush tax cuts were followed by 52 consecutive months of economic growth and, I might add, by a huge increase in federal revenue (the problem was that Congress increased spending even more rapidly than revenue rose). The tax cuts had nothing to do with the financial collapse.

Did Deregulation and Capitalism Cause the Financial Crisis

The Facts About Tax Cuts, Revenue, and Growth

As many financial experts have noted, the mark-to-market provisions of the Sarbanes-Oxley bill, which Bush signed, made the financial crisis a lot worse than it should have been. Under that provision, if certain, say, real estate investments were doing badly, the company had to mark all real estate investments at the same level as those doing badly. That was a truly insane, stupid provision and a perfect example of how misguided regulation can do enormous damage.

The days of screwing the workers and their families are over Conservatives. Why do you think so many young people hate the Tea Party? Its that tea party attitude of employer first. You had your fun. Time to let your wage slaves go.

Huh? Say what? Median income family has gone DOWN under Obama. It went UP under Bush, Clinton, and Reagan, but has dropped significantly under Obama. Obama has hosed workers and their families worse than any president in the last 50 years.

"So-called 'employers'"? Uh, they ARE employers. They are the men and women who own businesses, who pay for part of their employees' health plans, who give raises, who open new offices, who develop new products, and who pay their employees' salaries. I don't know anyone who does not work for a "rich" person, if we define "rich" as anyone in the top two income tax brackets.

Personally, I want to see our big businesses get bigger, because as they grow they hire more workers. I want to see our small businesses become big businesses, and to be rewarded for their success, not punished and demonized. Personally, I like it when an American small business grows, hires more people, opens more offices, etc., etc. I don't envy their success--I cheer it.

The real problem with the Bush tax cuts is that they reduced rates to a point that should we hit an economic downturn, revenues would plummet drastically, which is exactly what happened. If you look at federal tax revenues as a percentage of GDP, we know that they dipped to as low as 15% of GDP, the lowest since before the Great Depression right after the economy tanked in 2008 and 2009. Now compare those tax revenues to when Ronald Reagan took office. In his first few years in office, despite a very bad recession, federal revenues were 19% of GDP and Reagan increased spending by almost double over the eight years he was in office. Regardless, that 4% difference is huge in total revenues and is the reason we have such a massive deficit. It amounts to more than half of the yearly deficit.
 
Over 7 Million jobs created, 500k in Manufacturing.
Stock Market went from 8K to 15K.
Corporate Profits are breaking records.
800 billion cut from the deficit.

Any wonder why Republicans are making up fake scandals?

Jobs created during U.S. presidential terms - Wikipedia, the free encyclopedia
http://www.nytimes.com/2012/09/15/b...obama-but-lower-for-his-predecessor.html?_r=0
More Jobs Created Under Obama Than Bush, Non-Partisan Report Finds | Politics And Regulation | Minyanville's Wall Street
Economically, Could Obama Be America's Best President? - Forbes
GOP Whips Up Scandals to Avoid Facing Obama's 'Most Rapid Deficit Reduction since WWII'

Seems the Republicans are seeing the writing on the wall.

Their gold standard, Bush, the Republican hero..was a dismal failure on almost every front.

And their nemesis, President Barack Obama, who won both elections by a popular and electoral majority.

Who got Osama Bin Laden.

Who saved the Auto and Financial industries.

Who has restored part of our standing world wide.

Is everything they hate.

Good governance and fair play.

Jobs that count towards a healthy economy are still losing jobs.
Such as manufacturing and construction.
But if you think the growth in the service or healthcare industry is something too be happy about go for it.

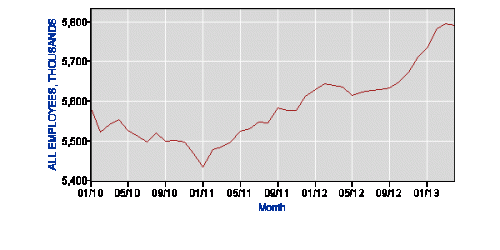
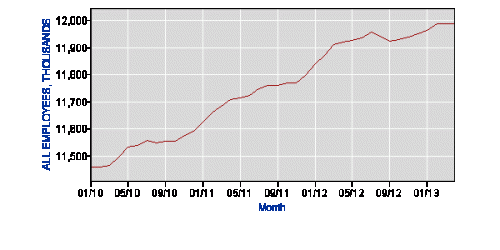
Except manufacturing and construction have been gaining jobs, not losing them

I don't know where you get your delusions of the construction industry gaining momentum, I'm in the commercial construction industry and it is been down in the vast majority of the United States (except for a few over in the west coast). Commercial construction has been struggling since Obama took office, and I have already provided facts where it has declined in 32 states. Perhaps you are somehow trying to make the case for the housing market making a comeback? However, commercial construction recovering in the private industry, simply is completely inaccurate.
 
Over 7 Million jobs created, 500k in Manufacturing.
Stock Market went from 8K to 15K.
Corporate Profits are breaking records.
800 billion cut from the deficit.

Any wonder why Republicans are making up fake scandals?

Jobs created during U.S. presidential terms - Wikipedia, the free encyclopedia
http://www.nytimes.com/2012/09/15/b...obama-but-lower-for-his-predecessor.html?_r=0
More Jobs Created Under Obama Than Bush, Non-Partisan Report Finds | Politics And Regulation | Minyanville's Wall Street
Economically, Could Obama Be America's Best President? - Forbes
GOP Whips Up Scandals to Avoid Facing Obama's 'Most Rapid Deficit Reduction since WWII'

Seems the Republicans are seeing the writing on the wall.

Their gold standard, Bush, the Republican hero..was a dismal failure on almost every front.

And their nemesis, President Barack Obama, who won both elections by a popular and electoral majority.

Who got Osama Bin Laden.

Who saved the Auto and Financial industries.

Who has restored part of our standing world wide.

Is everything they hate.

Good governance and fair play.

Jobs that count towards a healthy economy are still losing jobs.
Such as manufacturing and construction.
But if you think the growth in the service or healthcare industry is something too be happy about go for it.

Except manufacturing and construction have been gaining jobs, not losing them

No those industries are not gaining

Yes, they have. Not back up to the level when Obama took office, but current trend is upward:
 

Attachments

  • $Construction.gif
    $Construction.gif
    5.5 KB · Views: 40
  • $Manufacturing.gif
    $Manufacturing.gif
    5.5 KB · Views: 35
Last edited:
Jobs that count towards a healthy economy are still losing jobs.
Such as manufacturing and construction.
But if you think the growth in the service or healthcare industry is something too be happy about go for it.

Except manufacturing and construction have been gaining jobs, not losing them

I don't know where you get your delusions of the construction industry gaining momentum, I'm in the commercial construction industry and it is been down in the vast majority of the United States (except for a few over in the west coast). Commercial construction has been struggling since Obama took office, and I have already provided facts where it has declined in 32 states. Perhaps you are somehow trying to make the case for the housing market making a comeback? However, commercial construction recovering in the private industry, simply is completely inaccurate.

Because you are haven't seen it means the industry isn't recovering?

Yeah..there was a slow down when Obama entered office.

NEWSFLASH: ONE OF THE WORST FINANCIAL CRISISES OCCURRED AT THE END OF THE BUSH ADMINISTRATION.

What exactly do you think that meant?

Everyone was affected.
 

Forum List

Back
Top