Navigation
Install the app
How to install the app on iOS
Follow along with the video below to see how to install our site as a web app on your home screen.
Note: This feature may not be available in some browsers.
More options
You are using an out of date browser. It may not display this or other websites correctly.
You should upgrade or use an alternative browser.
You should upgrade or use an alternative browser.
No Sea Level Rise says Isle of the Dead
- Thread starter elektra
- Start date
- Status
- Not open for further replies.
Old Rocks
Diamond Member
From the bottom of the OP.Nothing in my OP is from this page, Old Crock, how about showing us where my quote is on this page or any page on the blog. Go ahead Old Crock, show where on this Blog they mention the Isle of the Dead, or simply wear your title of liar.150 year old mark shows no ocean rise
Extracted from here and its numerous links.
Leftist media saturates the news. Fight back. Send articles to your friends, politicians, local media, and facebook.
And where is here?
The scandal of sea levels — rising trends, acceleration — largely created by adjustments « JoNova
The scandal of sea levels — rising trends, acceleration — largely created by adjustments
Headlines across Australia yesterday told us the dire news that a new study finds that “Sea level rising faster in past 20 years than in entire 20th century“. A new paper by Watson et al is driving the headlines, but underneath this Nature paper is a swamp of adjustments, an error larger than the signal, and the result disagrees with many other studies and almost all the raw measurements. Paper after paper kept showing that sea levels rates had slowed (e.g Chen showed deceleration from 2004, Cazenave said in the last decade sea-levels had slowed 30% (but argued post hoc adjustments could solve that). Beenstock used 1000 tide gauges and found no acceleration of sea levels over the last 50 years. A different researcher — Phil Watson, found that Australian sea levels rose faster before World War II then slowed down.)
While my initial post was from a blog, it refered to this source, which I put in a later post. It is from real scientists, and not the denialists at Jo Nova.
http://www.bom.gov.au/ntc/IDO60202/IDO60202.2011.pdf
This report was prepared by: National Tidal Centre Australian Bureau of Meteorology GPO Box 421 Kent Town SA 5071 Australia Tel: (+618) 8366 2730 Fax: (+618) 8366 2651 Email: [email protected] Website: Oceanography Quality Certification: I authorise the issue of this Australian Baseline Sea Level Monitoring Project Annual Sea Level Data Summary Report for July 2010 - June 2011 in accordance with the quality assurance procedures of the National Tidal Centre, Australian Bureau of Meteorology.
Elektra, once again you have been outed as not so very intelligent. Really, start investigating before making a fool of yourself.
And well you are it, how about answering the last post you ran from, where you incorrectly posted W=IR for the formula for power, which is P=IE, Old Crock also stated 1 amp does not create 12 watts, yet according to the formula, P=IE, or
12w = 1 amp x 12 volts.
That will be two posts in a row Old Crock, if you can not copy/paste/link my OP quote from the blog you make the claim that it came from. So go ahead, show us how my quoted comment came from the link you are digging in. Or simply be the LIAR that you are.
Go, OLD CROCK THE LIAR, prove your claim.
None of the stuff you quote, have I used in this thread, none of the stuff I quote in my OP is anywhere on that Blog site.
Nice try, idiot. But you let another idiot lead you down a dead end alley you can not get out of.
Tasmanian Sea Levels - Lessons from the Isle of the Dead
Measuring sea-level rise at Port Arthur
150 year old mark shows no ocean rise
I added some links to the OP.
.................................................................................................................................
The above is from your OP. And, from 150 year old mark shows no ocean rise
Extracted from here and its numerous links.
.................................................................................................................................
Leftist media saturates the news. Fight back. Send articles to your friends, politicians, local media, and facebook
............................................................................................................................
And if you link to 'here' you get The scandal of sea levels — rising trends, acceleration — largely created by adjustments « JoNova
Two claims just proven, 1st that you article linked back to Jo Nova nonsense, 2nd, that you are one extremely unintelligent individual.
elektra
Platinum Member
- Thread starter
- #43
Yes, and like I reiterated, Liar, nothing in my OP is found on that Blog, otherwise you could link to it. My Link is not to a blog, and the Content I posted is not from the blog you link to.From the bottom of the OP.
Tasmanian Sea Levels - Lessons from the Isle of the Dead
Measuring sea-level rise at Port Arthur
150 year old mark shows no ocean rise
I added some links to the OP.
.................................................................................................................................
The above is from your OP. And, from 150 year old mark shows no ocean rise
Extracted from here and its numerous links.
.................................................................................................................................
Leftist media saturates the news. Fight back. Send articles to your friends, politicians, local media, and facebook
............................................................................................................................
And if you link to 'here' you get The scandal of sea levels — rising trends, acceleration — largely created by adjustments « JoNova
Two claims just proven, 1st that you article linked back to Jo Nova nonsense, 2nd, that you are one extremely unintelligent individual.
So again, unless you can find my picture and the Story of the Isle of the Dead on that Blog you are simply a LIAR, as you call others you are yourself.
Easy as PIE, Power equals Current times Voltage, OLD CROCK THE LIAR
Now go to the blog and find your smoking gun or simply be a liar.
Old Rocks
Diamond Member
Sea level rises aren't what worry me the most.
If the Arctic melts sea levels will DROP. If the water on the land of the Antarctic melt, the then sea will rise.
So, the reality is, if the Antarctic and Arctic melt a little, the effects might not be noticed at first. Later on when more and more land based ice is melting, then that is when problems will occur.
The problem is the PH levels of the oceans. I read about sea lions dying off because they can't cope with the level of change of the PH in the oceans. Other sea creatures will be the same, and this is the biggest and most worrying part of polluting the atmosphere we're going to see first.
Wrong kind of acid, dude. The sea lions are possibly suffering from brain damage due to ingestion of DOMOIC ACID which is a product of dead critters.
Sea lion deaths linked to severe brain damage caused by toxic algae bloom
The findings provide critical new information about the impacts of domoic acid, which has increasingly devastated wildlife – and fishermen – in recent years.
The toxin is the reason why the season for Dungeness crab, a well-known and lucrative fishery along the west coast, has been delayed this year and has increasingly become one of the main impacts of warmer waters along the west coast as domoic acid-producing algal blooms grow larger and longer-lasting.
Those impacts have grown rapidly and recently.
In 1998, hundreds of sea lions experiencing seizures stranded off Monterey Bay, 75 miles south of San Francisco. At first, the reason for the seizures was a mystery. “People thought it was mercury poisoning,” said Kathi Lefebvre, a National Oceanic and Atmospheric Administration scientist who was not involved in the new research. She happened to be looking at the effects of domoic acid in fish in 1998 and thought the toxin might be the cause for sea lion seizures.
It turned out to be the first documented case of domoic acid poisoning in marine life. Those cases have grown since, and this year could be the worst ever. “Every year since – for the last 17 years – there have been sick and dying sea lions, sometimes in the hundreds,” Lefebvre said.
This year was the first in which a sea lion affected by domoic acid poisoning was reported north of California, she said. “What we’re most concerned about right now is this year we have had the likely largest ever recorded algal bloom producing domoic acid on the US west coast, spanning the largest geographic range.”
Historically, the toxic algal bloom would last just a few weeks, but due to warmer waters from climate change and this year’s El Niño weather phenomenon, this year’s bloom lasted for months. She said that persistence and its northward expansion makes studying the “sub-lethal chronic effects” domoic acid has on animals particularly important.
A text book case of a negative effect of global warming.
Old Rocks
Diamond Member
Crap, talk about doubling down on stupid, here is quoted material in your original post in it's entirety. Notice at the bottom where it tells you the source of their article. My God, man, you are stupid!Yes, and like I reiterated, Liar, nothing in my OP is found on that Blog, otherwise you could link to it. My Link is not to a blog, and the Content I posted is not from the blog you link to.From the bottom of the OP.
Tasmanian Sea Levels - Lessons from the Isle of the Dead
Measuring sea-level rise at Port Arthur
150 year old mark shows no ocean rise
I added some links to the OP.
.................................................................................................................................
The above is from your OP. And, from 150 year old mark shows no ocean rise
Extracted from here and its numerous links.
.................................................................................................................................
Leftist media saturates the news. Fight back. Send articles to your friends, politicians, local media, and facebook
............................................................................................................................
And if you link to 'here' you get The scandal of sea levels — rising trends, acceleration — largely created by adjustments « JoNova
Two claims just proven, 1st that you article linked back to Jo Nova nonsense, 2nd, that you are one extremely unintelligent individual.
So again, unless you can find my picture and the Story of the Isle of the Dead on that Blog you are simply a LIAR, as you call others you are yourself.
Easy as PIE, Power equals Current times Voltage, OLD CROCK THE LIAR
Now go to the blog and find your smoking gun or simply be a liar.
150 year old mark shows no ocean rise
 Isle of the Dead
The ‘Isle of the Dead’ may yet prove to be another nail in the coffin of global warming and its gruesome companion, Disastrous Sea Level Rises.
The `Isle of the Dead’ is over two acres in size and is situated within the harbor of Port Arthur opening directly to the Southern Ocean. The isle itself is actually a graveyard (thus its eerie name), containing the graves of some 2,000 British convicts and free persons from the 19th century who lived and died at the nearby convict colony of Port Arthur between 1832 and 1870.
In 1841. renowned British Antarctic explorer, Captain Sir James Clark Ross, sailed into Tassy after a 6-month voyage of discovery and exploration to the Antarctic.
Ross and Governor Franklin made a particular point of visiting Port Arthur, to meet Thomas Lempriere, a senior official of the convict colony there, but who was also a methodical observer and recorder of meteorological, tidal, and astronomical data. It is important to note what Captain Ross wrote about it.
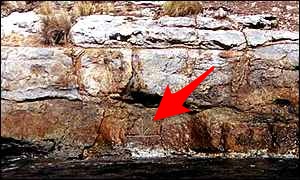
“My principal object in visiting Port Arthur was to afford a comparison of our standard barometer with that which had been employed for several years by Mr. Lempriere, the Deputy Assistant Commissary General, in accordance with my instructions, and also to establish a permanent mark at the zero point, or general mean level of the sea as determined by the tidal observations which Mr. Lempriere had conducted with perseverance and exactness for some time: by which means any secular variation in the relative level of the land and sea, which is known to occur on some coasts, might at any future period be detected, and its amount determined.
The point chosen for this purpose was the perpendicular cliff of the small islet off Point Puer, which, being near to the tide register, rendered the operation more simple and exact. The Governor, whom I had accompanied on an official visit to the settlement, gave directions to afford Mr. Lempriere every assistance of labourers he required, to have the mark cut deeply in the rock in the exact spot which his tidal observations indicated as the mean level of the ocean.
That mark is still there today, as can be seen in the photo.The photo was taken at midway between high and low tides.
There is intensive research presently underway by several institutions including the now corrupt CSIRO assisted by the head of the Inter-Agency Committee on Marine Science & Technology, Dr David Pugh, who is based at the University of Southampton, UK. But in spite of plenty of time we have yet to see their detailed explanation of just why this mark confounds all the predictions about sea level rise.
Dr. Pugh airily waves his hands and says in effect that poor old confused Lempriere, in spite of the detailed instructions about getting a Mean Sea Level (half way between high and low tide), he just put in the high water mark. This, of course, sounds logical to anybody steeped in the Green religion.
But not to anyone else and not to real scientists who look at evidence unflinchingly.
Be that as it may, the Australian National Tidal Facility at Flinders University in Adelaide published a `Mean Sea Level Survey’ in 1998 to establish sea level trends around the Australian coast from tide gauges having more than 23 years of hourly data in their archive. This survey was particularly relevant for global application since Australia is tectonically stable and much less affected by Post Glacial Rebound (the tendency of land to rise once the burden of billions of tons of ice goes) than Europe, Asia or North America.
It did not include Tasmania possibly because University types do not recognise Tasmania as part of Australia, possibly because somehow the dumb Tasmanians had not yet got around to measuring sea levels in 1975.
Since nearly two-thirds of the world’s total oceanic area is in the southern hemisphere, Australia is best placed to monitor southern hemisphere trends and probably best represents the true Mean Sea Level globally. Also, the Australian coast adjoins the Indian, Pacific, and Southern Oceans, making its data indicative of sea levels in three oceans, not just one.
The National Tidal Facility identified tide gauges in stations running anti-clockwise around Australia starting with Darwin.
Eleven of the 27 stations recorded a sea level fall, while the mean rate of sea level rise for all the stations combined is only +0.3 mm/yr, with an average record length of 36.4 years. This is only one sixth of the IPCC figure. There was also no obvious geographical pattern of falls versus rises as both were distributed along all parts of the coast.
But there’s more. It was shown earlier that Adelaide was a prime example of local sea level rise due to urban subsidence [3]. It’s two stations in the above list are the only ones to record a sea level rise greater than the IPCC estimate. The same NTF survey pointed out the Adelaide anomaly and directly attributed it to local subsidence, not sea level rise, on the grounds that the neighboring stations of Port Lincoln, Port Pirie and Victor Harbour only show a rise of +0.3 mm/yr between them. If we exclude Adelaide from the list, the average sea level rise for the other 25 stations is then only +0.16 mm/yr, or less than one tenth of the IPCC estimate.
If this world tour, ending with the Australian survey, were not convincing enough, there is one further piece of evidence from Australia which demonstrates that the IPCC, and the ICE-3G model which underpins their predictions, is wrong about the magnitude of 20th century sea level rise.
So do your best to memorise this and whenever Fairfax runs its monthly big scare about burning cities, desert, and huge sea levels that will affect our (great x 15o) grandchildren if we leave the porch light on, write into them and point all this out.
Or write to the Councils around Australia who are running like Chicken Little drawing imaginary lines where the sea will come up to and forbidding anyone to build their home or repair it beyond them.
And a fat lot of good it will do you.
Extracted from here and its numerous links.
Leftist media saturates the news. Fight back. Send articles to your friends, politicians, local media, and facebook.
elektra
Platinum Member
- Thread starter
- #46
Nice, you can quote from a website that is not the blog where you are making the claim my content came from, it is not my problem you are reaching for straws again old crock.Crap, talk about doubling down on stupid, here is quoted material in your original post in it's entirety. Notice at the bottom where it tells you the source of their article. My God, man, you are stupid!Yes, and like I reiterated, Liar, nothing in my OP is found on that Blog, otherwise you could link to it. My Link is not to a blog, and the Content I posted is not from the blog you link to.From the bottom of the OP.
Tasmanian Sea Levels - Lessons from the Isle of the Dead
Measuring sea-level rise at Port Arthur
150 year old mark shows no ocean rise
I added some links to the OP.
.................................................................................................................................
The above is from your OP. And, from 150 year old mark shows no ocean rise
Extracted from here and its numerous links.
.................................................................................................................................
Leftist media saturates the news. Fight back. Send articles to your friends, politicians, local media, and facebook
............................................................................................................................
And if you link to 'here' you get The scandal of sea levels — rising trends, acceleration — largely created by adjustments « JoNova
Two claims just proven, 1st that you article linked back to Jo Nova nonsense, 2nd, that you are one extremely unintelligent individual.
So again, unless you can find my picture and the Story of the Isle of the Dead on that Blog you are simply a LIAR, as you call others you are yourself.
Easy as PIE, Power equals Current times Voltage, OLD CROCK THE LIAR
Now go to the blog and find your smoking gun or simply be a liar.
150 year old mark shows no ocean rise
Isle of the Dead
The ‘Isle of the Dead’ may yet prove to be another nail in the coffin of global warming and its gruesome companion, Disastrous Sea Level Rises.
The `Isle of the Dead’ is over two acres in size and is situated within the harbor of Port Arthur opening directly to the Southern Ocean. The isle itself is actually a graveyard (thus its eerie name), containing the graves of some 2,000 British convicts and free persons from the 19th century who lived and died at the nearby convict colony of Port Arthur between 1832 and 1870.
In 1841. renowned British Antarctic explorer, Captain Sir James Clark Ross, sailed into Tassy after a 6-month voyage of discovery and exploration to the Antarctic.
Ross and Governor Franklin made a particular point of visiting Port Arthur, to meet Thomas Lempriere, a senior official of the convict colony there, but who was also a methodical observer and recorder of meteorological, tidal, and astronomical data. It is important to note what Captain Ross wrote about it.
“My principal object in visiting Port Arthur was to afford a comparison of our standard barometer with that which had been employed for several years by Mr. Lempriere, the Deputy Assistant Commissary General, in accordance with my instructions, and also to establish a permanent mark at the zero point, or general mean level of the sea as determined by the tidal observations which Mr. Lempriere had conducted with perseverance and exactness for some time: by which means any secular variation in the relative level of the land and sea, which is known to occur on some coasts, might at any future period be detected, and its amount determined.
The point chosen for this purpose was the perpendicular cliff of the small islet off Point Puer, which, being near to the tide register, rendered the operation more simple and exact. The Governor, whom I had accompanied on an official visit to the settlement, gave directions to afford Mr. Lempriere every assistance of labourers he required, to have the mark cut deeply in the rock in the exact spot which his tidal observations indicated as the mean level of the ocean.
That mark is still there today, as can be seen in the photo.The photo was taken at midway between high and low tides.
There is intensive research presently underway by several institutions including the now corrupt CSIRO assisted by the head of the Inter-Agency Committee on Marine Science & Technology, Dr David Pugh, who is based at the University of Southampton, UK. But in spite of plenty of time we have yet to see their detailed explanation of just why this mark confounds all the predictions about sea level rise.
Dr. Pugh airily waves his hands and says in effect that poor old confused Lempriere, in spite of the detailed instructions about getting a Mean Sea Level (half way between high and low tide), he just put in the high water mark. This, of course, sounds logical to anybody steeped in the Green religion.
But not to anyone else and not to real scientists who look at evidence unflinchingly.
Be that as it may, the Australian National Tidal Facility at Flinders University in Adelaide published a `Mean Sea Level Survey’ in 1998 to establish sea level trends around the Australian coast from tide gauges having more than 23 years of hourly data in their archive. This survey was particularly relevant for global application since Australia is tectonically stable and much less affected by Post Glacial Rebound (the tendency of land to rise once the burden of billions of tons of ice goes) than Europe, Asia or North America.
It did not include Tasmania possibly because University types do not recognise Tasmania as part of Australia, possibly because somehow the dumb Tasmanians had not yet got around to measuring sea levels in 1975.
Since nearly two-thirds of the world’s total oceanic area is in the southern hemisphere, Australia is best placed to monitor southern hemisphere trends and probably best represents the true Mean Sea Level globally. Also, the Australian coast adjoins the Indian, Pacific, and Southern Oceans, making its data indicative of sea levels in three oceans, not just one.
The National Tidal Facility identified tide gauges in stations running anti-clockwise around Australia starting with Darwin.
Eleven of the 27 stations recorded a sea level fall, while the mean rate of sea level rise for all the stations combined is only +0.3 mm/yr, with an average record length of 36.4 years. This is only one sixth of the IPCC figure. There was also no obvious geographical pattern of falls versus rises as both were distributed along all parts of the coast.
But there’s more. It was shown earlier that Adelaide was a prime example of local sea level rise due to urban subsidence [3]. It’s two stations in the above list are the only ones to record a sea level rise greater than the IPCC estimate. The same NTF survey pointed out the Adelaide anomaly and directly attributed it to local subsidence, not sea level rise, on the grounds that the neighboring stations of Port Lincoln, Port Pirie and Victor Harbour only show a rise of +0.3 mm/yr between them. If we exclude Adelaide from the list, the average sea level rise for the other 25 stations is then only +0.16 mm/yr, or less than one tenth of the IPCC estimate.
If this world tour, ending with the Australian survey, were not convincing enough, there is one further piece of evidence from Australia which demonstrates that the IPCC, and the ICE-3G model which underpins their predictions, is wrong about the magnitude of 20th century sea level rise.
So do your best to memorise this and whenever Fairfax runs its monthly big scare about burning cities, desert, and huge sea levels that will affect our (great x 15o) grandchildren if we leave the porch light on, write into them and point all this out.
Or write to the Councils around Australia who are running like Chicken Little drawing imaginary lines where the sea will come up to and forbidding anyone to build their home or repair it beyond them.
And a fat lot of good it will do you.
Extracted from here and its numerous links.
Leftist media saturates the news. Fight back. Send articles to your friends, politicians, local media, and facebook.
Copy and Paste from the blog, you can not show that any of my content came from that blog, cause it did not.
Last edited:
Old Rocks
Diamond Member
Damn. Tripling down on stupid. Oh well, from Elektra, that is the norm. Your OP came from the Australian Morning Mail, which stated at the bottom of the article that the source of it's information was Jo Nova, and the links at Jo Nova. Even a moron can follow a two step link. Please work hard and try to achieve that status.
elektra
Platinum Member
- Thread starter
- #48
Damn. Tripling down on stupid. Oh well, from Elektra, that is the norm. Your OP came from the Australian Morning Mail, which stated at the bottom of the article that the source of it's information was Jo Nova, and the links at Jo Nova. Even a moron can follow a two step link. Please work hard and try to achieve that status.
Follow the two step link, copy and paste and link showing my content came from the blog, and prove you are not a moron, old crock the liar.
Even a moron can do it, as you state Old Crock, so do it!
Last edited:
elektra
Platinum Member
- Thread starter
- #49
No, A textbook case of Old Crock cherry picking. Textbook is one word, Old Crock, 4th grade stuff, idiot.A text book case of a negative effect of global warming.
Now educate us on the difference between, fact, theory, and a hypotheses and what does it mean when they state they have no data to test the hypotheses?
If I can quote from Old Crock's link.
US west coast toxic algae bloom might be largest ever, say scientists
“But we also agreed we don’t really have the data yet to test those hypotheses.”
flacaltenn
Diamond Member
Elektra, now can you tell us the one about how scientists cut down a tree because they hated how it disproved sea level rise? I think that's my all-time favorite denier fairy tale.
Measuring sea-level rise at Port Arthur
---
A paper published in 1889 by Captain Shortt recorded the wording of the plaque, including the time the mark was struck and the height of the sea given by Lempriere's tide gauge. By taking a measurement of the height of the sea, and estimating what the tides were when the mark was made, Shortt determined that the mark was made near high water.
---
There can be only one explanation. The conspiracy goes back to 1889.
The Port Arthur area as a whole, including that island, is having gradually worsening tidal flooding problems. It didn't have those problems before. Hmm, I wonder what could be causing such a thing?
So where's the pic of this "mark" at HIGH tide? and LOW tide for that matter. Let us judge for ourselves.
So many links --- so many articles and NOT ONE high tide pic??
flacaltenn
Diamond Member
If you really want your head to hurt -- there's been several real papers written and about 19 brawls broken out about debating this ancient artifact. Some jerks even use the mark to attempt to justify the IPCC estimates (modeling) of sea level rise since the 1800s.
Lot more complicated than taking a few pics and comparing. First of all, you'd have to match lunar cycles with the date the mark was set and get the proper interpretation of where it was put (high./mean/ low/ect).. And if the original guys "averaged" the mean observation over what period. Because the NATURAL variation in high or low tide exceeds the SLR since that period.
On top of it ALL --- the drama gets better. There was a major EARTHQUAKE changing the coast height by about 10cm.. Good luck with all that. I'm sure there's an answer. Let me know when you find it there Captain Blight.
Tasmanian Sea Levels - Lessons from the Isle of the Dead Real interesting reading. And there's a Part2 for those determined to figure out what all this means and where the bootie is buried.
frigidweirdo
Diamond Member
- Mar 7, 2014
- 46,777
- 10,156
- 2,030
Though I had a look and it said actually sea water would rise slightly because if you add fresh water to salt water the level will rise.
Whether I add melted Snickers, shaving cream or pure liquid mercury to salt water, adding one liquid to another will make it's level rise. I believe you are referring to the issue of non-linear molar property merging. There are several liquids you can mix whose sum will be less than the sum of their component parts. Water and saline solutions have such a relationship. So when adding fresh water to salt water the resultant volume increase will be less than a simple addition would indicate. It will NOT, however, under ANY circumstances, result in a combined volume LESS than that of either original component. Adding fresh water to the ocean will not lower sea level particularly since doing so REDUCES the total salinity and the magnitude of this effect. The difference is minute in any case, a matter of fractions of a cc per mole (and a mole is 22.4 liters)
I didn't say the effect was big, but the effect is there. Not that it's that important. The issue was that the Antarctic melting is the biggest issue.
What would happen if the Antarctic ice melted and went into the sea? Not only from the level of the sea, but PH levels, the impact on animal life etc etc.
frigidweirdo
Diamond Member
- Mar 7, 2014
- 46,777
- 10,156
- 2,030
Crap, talk about doubling down on stupid, here is quoted material in your original post in it's entirety. Notice at the bottom where it tells you the source of their article. My God, man, you are stupid!Yes, and like I reiterated, Liar, nothing in my OP is found on that Blog, otherwise you could link to it. My Link is not to a blog, and the Content I posted is not from the blog you link to.From the bottom of the OP.
Tasmanian Sea Levels - Lessons from the Isle of the Dead
Measuring sea-level rise at Port Arthur
150 year old mark shows no ocean rise
I added some links to the OP.
.................................................................................................................................
The above is from your OP. And, from 150 year old mark shows no ocean rise
Extracted from here and its numerous links.
.................................................................................................................................
Leftist media saturates the news. Fight back. Send articles to your friends, politicians, local media, and facebook
............................................................................................................................
And if you link to 'here' you get The scandal of sea levels — rising trends, acceleration — largely created by adjustments « JoNova
Two claims just proven, 1st that you article linked back to Jo Nova nonsense, 2nd, that you are one extremely unintelligent individual.
So again, unless you can find my picture and the Story of the Isle of the Dead on that Blog you are simply a LIAR, as you call others you are yourself.
Easy as PIE, Power equals Current times Voltage, OLD CROCK THE LIAR
Now go to the blog and find your smoking gun or simply be a liar.
150 year old mark shows no ocean rise
The ‘Isle of the Dead’ may yet prove to be another nail in the coffin of global warming and its gruesome companion, Disastrous Sea Level Rises.
The `Isle of the Dead’ is over two acres in size and is situated within the harbor of Port Arthur opening directly to the Southern Ocean. The isle itself is actually a graveyard (thus its eerie name), containing the graves of some 2,000 British convicts and free persons from the 19th century who lived and died at the nearby convict colony of Port Arthur between 1832 and 1870.
In 1841. renowned British Antarctic explorer, Captain Sir James Clark Ross, sailed into Tassy after a 6-month voyage of discovery and exploration to the Antarctic.
Ross and Governor Franklin made a particular point of visiting Port Arthur, to meet Thomas Lempriere, a senior official of the convict colony there, but who was also a methodical observer and recorder of meteorological, tidal, and astronomical data. It is important to note what Captain Ross wrote about it.
“My principal object in visiting Port Arthur was to afford a comparison of our standard barometer with that which had been employed for several years by Mr. Lempriere, the Deputy Assistant Commissary General, in accordance with my instructions, and also to establish a permanent mark at the zero point, or general mean level of the sea as determined by the tidal observations which Mr. Lempriere had conducted with perseverance and exactness for some time: by which means any secular variation in the relative level of the land and sea, which is known to occur on some coasts, might at any future period be detected, and its amount determined.
The point chosen for this purpose was the perpendicular cliff of the small islet off Point Puer, which, being near to the tide register, rendered the operation more simple and exact. The Governor, whom I had accompanied on an official visit to the settlement, gave directions to afford Mr. Lempriere every assistance of labourers he required, to have the mark cut deeply in the rock in the exact spot which his tidal observations indicated as the mean level of the ocean.
That mark is still there today, as can be seen in the photo.The photo was taken at midway between high and low tides.
There is intensive research presently underway by several institutions including the now corrupt CSIRO assisted by the head of the Inter-Agency Committee on Marine Science & Technology, Dr David Pugh, who is based at the University of Southampton, UK. But in spite of plenty of time we have yet to see their detailed explanation of just why this mark confounds all the predictions about sea level rise.
Dr. Pugh airily waves his hands and says in effect that poor old confused Lempriere, in spite of the detailed instructions about getting a Mean Sea Level (half way between high and low tide), he just put in the high water mark. This, of course, sounds logical to anybody steeped in the Green religion.
But not to anyone else and not to real scientists who look at evidence unflinchingly.
Be that as it may, the Australian National Tidal Facility at Flinders University in Adelaide published a `Mean Sea Level Survey’ in 1998 to establish sea level trends around the Australian coast from tide gauges having more than 23 years of hourly data in their archive. This survey was particularly relevant for global application since Australia is tectonically stable and much less affected by Post Glacial Rebound (the tendency of land to rise once the burden of billions of tons of ice goes) than Europe, Asia or North America.
It did not include Tasmania possibly because University types do not recognise Tasmania as part of Australia, possibly because somehow the dumb Tasmanians had not yet got around to measuring sea levels in 1975.
Since nearly two-thirds of the world’s total oceanic area is in the southern hemisphere, Australia is best placed to monitor southern hemisphere trends and probably best represents the true Mean Sea Level globally. Also, the Australian coast adjoins the Indian, Pacific, and Southern Oceans, making its data indicative of sea levels in three oceans, not just one.
The National Tidal Facility identified tide gauges in stations running anti-clockwise around Australia starting with Darwin.
Eleven of the 27 stations recorded a sea level fall, while the mean rate of sea level rise for all the stations combined is only +0.3 mm/yr, with an average record length of 36.4 years. This is only one sixth of the IPCC figure. There was also no obvious geographical pattern of falls versus rises as both were distributed along all parts of the coast.
But there’s more. It was shown earlier that Adelaide was a prime example of local sea level rise due to urban subsidence [3]. It’s two stations in the above list are the only ones to record a sea level rise greater than the IPCC estimate. The same NTF survey pointed out the Adelaide anomaly and directly attributed it to local subsidence, not sea level rise, on the grounds that the neighboring stations of Port Lincoln, Port Pirie and Victor Harbour only show a rise of +0.3 mm/yr between them. If we exclude Adelaide from the list, the average sea level rise for the other 25 stations is then only +0.16 mm/yr, or less than one tenth of the IPCC estimate.
If this world tour, ending with the Australian survey, were not convincing enough, there is one further piece of evidence from Australia which demonstrates that the IPCC, and the ICE-3G model which underpins their predictions, is wrong about the magnitude of 20th century sea level rise.
So do your best to memorise this and whenever Fairfax runs its monthly big scare about burning cities, desert, and huge sea levels that will affect our (great x 15o) grandchildren if we leave the porch light on, write into them and point all this out.
Or write to the Councils around Australia who are running like Chicken Little drawing imaginary lines where the sea will come up to and forbidding anyone to build their home or repair it beyond them.
And a fat lot of good it will do you.
Extracted from here and its numerous links.
Leftist media saturates the news. Fight back. Send articles to your friends, politicians, local media, and facebook.
Funny, you show where the sea level was and then an hour later it's much higher or lower, and you think you can show a line and prove something 1000 years later.... er......
Really? Do you actually think that argument has merit? I guess no one ever noticed waves and tides and wind surges before. What an astounding discovery you've made. It will revolutionize the field.
Do you know what a modern wave gauge looks like? How it works.Are you familiar with capacitors? The capacitance of a capacitor is dependent on a few things, one of which is the area of its plates. If you take a metal rod, cover it with plastic, it forms one plate and the electrolytic barrier of a capacitor. The other plate is formed by our conductive sea water. The rod is installed sticking down through mean sea level. As the water rises and falls, the capacitance of the assembly is altered directly by the rise and fall of the water. Thus sea level can be monitored continuously (with an analog circuit) or extremely rapidly (with a fast-sampling digital circuit) and the results both recorded as frequently as you like and fed into an integrator to determine the mean value over any running time span you care to use.
Do you know what a modern wave gauge looks like? How it works.Are you familiar with capacitors? The capacitance of a capacitor is dependent on a few things, one of which is the area of its plates. If you take a metal rod, cover it with plastic, it forms one plate and the electrolytic barrier of a capacitor. The other plate is formed by our conductive sea water. The rod is installed sticking down through mean sea level. As the water rises and falls, the capacitance of the assembly is altered directly by the rise and fall of the water. Thus sea level can be monitored continuously (with an analog circuit) or extremely rapidly (with a fast-sampling digital circuit) and the results both recorded as frequently as you like and fed into an integrator to determine the mean value over any running time span you care to use.
elektra
Platinum Member
- Thread starter
- #55
How about a link to this gauge, which would be interesting to see what you got wrong.Really? Do you actually think that argument has merit? I guess no one ever noticed waves and tides and wind surges before. What an astounding discovery you've made. It will revolutionize the field.
Do you know what a modern wave gauge looks like? How it works.Are you familiar with capacitors? The capacitance of a capacitor is dependent on a few things, one of which is the area of its plates. If you take a metal rod, cover it with plastic, it forms one plate and the electrolytic barrier of a capacitor. The other plate is formed by our conductive sea water. The rod is installed sticking down through mean sea level. As the water rises and falls, the capacitance of the assembly is altered directly by the rise and fall of the water. Thus sea level can be monitored continuously (with an analog circuit) or extremely rapidly (with a fast-sampling digital circuit) and the results both recorded as frequently as you like and fed into an integrator to determine the mean value over any running time span you care to use.
The one glaring error I see is you begin by speaking of a wave gauge, last I checked TIDE gauges are what are used to measure the Sea Level, not Wave Gauges.
Either way a link to your idea would be interesting.
[I am adding this comment after 2 hours of reading, Sea level is not measured with capacitance, maybe Salinity, not sea level or tide levels]
Last edited:
CrusaderFrank
Diamond Member
- May 20, 2009
- 147,405
- 70,601
- 2,330
Though I had a look and it said actually sea water would rise slightly because if you add fresh water to salt water the level will rise.
Whether I add melted Snickers, shaving cream or pure liquid mercury to salt water, adding one liquid to another will make it's level rise. I believe you are referring to the issue of non-linear molar property merging. There are several liquids you can mix whose sum will be less than the sum of their component parts. Water and saline solutions have such a relationship. So when adding fresh water to salt water the resultant volume increase will be less than a simple addition would indicate. It will NOT, however, under ANY circumstances, result in a combined volume LESS than that of either original component. Adding fresh water to the ocean will not lower sea level particularly since doing so REDUCES the total salinity and the magnitude of this effect. The difference is minute in any case, a matter of fractions of a cc per mole (and a mole is 22.4 liters)
I didn't say the effect was big, but the effect is there. Not that it's that important. The issue was that the Antarctic melting is the biggest issue.
What would happen if the Antarctic ice melted and went into the sea? Not only from the level of the sea, but PH levels, the impact on animal life etc etc.
Antarctica is not melting
frigidweirdo
Diamond Member
- Mar 7, 2014
- 46,777
- 10,156
- 2,030
Though I had a look and it said actually sea water would rise slightly because if you add fresh water to salt water the level will rise.
Whether I add melted Snickers, shaving cream or pure liquid mercury to salt water, adding one liquid to another will make it's level rise. I believe you are referring to the issue of non-linear molar property merging. There are several liquids you can mix whose sum will be less than the sum of their component parts. Water and saline solutions have such a relationship. So when adding fresh water to salt water the resultant volume increase will be less than a simple addition would indicate. It will NOT, however, under ANY circumstances, result in a combined volume LESS than that of either original component. Adding fresh water to the ocean will not lower sea level particularly since doing so REDUCES the total salinity and the magnitude of this effect. The difference is minute in any case, a matter of fractions of a cc per mole (and a mole is 22.4 liters)
I didn't say the effect was big, but the effect is there. Not that it's that important. The issue was that the Antarctic melting is the biggest issue.
What would happen if the Antarctic ice melted and went into the sea? Not only from the level of the sea, but PH levels, the impact on animal life etc etc.
Antarctica is not melting
Christ, this is like one giant game of Chinese whispers.
My initial post said that the main point to worry about was the PH level of the sea changing, and not the ice caps melting. So everyone just goes of the thing that wasn't so important.
However.....
Antarctic ice shelves are melting dramatically, study finds
"A team of US scientists looked at 18 years’ worth of satellite data and found the floating ice shelves that skirt the continent are losing 310km3 of ice every year. One shelf lost 18% of its thickness during the period."
NASA - Is Antarctica Melting?
"One new paper 1, which states there’s less surface melting recently than in past years, has been cited as "proof" that there’s no global warming. Other evidence that the amount of sea ice around Antarctica seems to be increasing slightly 2-4 is being used in the same way. But both of these data points are misleading."
"Gravity data collected from space using NASA's Grace satellite show that Antarctica has been losing more than a hundred cubic kilometers (24 cubic miles) of ice each year since 2002."
Yes, it's melting. However it's not melting in a manner which makes sense to some people, and some facts are often misinterpreted and then passed on to other people who then claim that this is total proof it's not melting.
And all that shit.
elektra
Platinum Member
- Thread starter
- #58
What is apparent, is there is a thousand different ways to measure things on Earth, and that the Earth is always changing.
Are the Ice Caps melting, sometimes yes and sometimes no.
Is the Sea Level rising? Maybe, Maybe not, how can you measure something that is always changing and effected by so many different things. The more I read about Sea Level the more I understand that it is a very subjective measurement at best.
elektra
Platinum Member
- Thread starter
- #59
To save this link in a place for future reference, it is interesting to note the accuracy of sea level measurements in the 19th Century.
Reading between the tides: 200 years of measuring global sea level | NOAA Climate.gov
Reading between the tides: 200 years of measuring global sea level | NOAA Climate.gov
Compared with the old technologies, the microwave sensors are more reliable and much cheaper to install and maintain—no boats, divers or regular manual attention required. However, the data they provide is only marginally more accurate. In fact, the accuracy of the monthly mean sea level observations—which most climate scientists use as a starting data point when looking at long-term ocean trends—as calculated using measurements from the microwave sensors is almost exactly the same as what scientists calculated using tide gauges in the 1800s, Bushnell says. That’s a testament to the painstaking, detail-obsessed work done by generations of tide gauge observers, technicians taking care of the equipment, and NOAA analysts putting together the results from all the nation’s gauges every month, according to Gill.
CrusaderFrank
Diamond Member
- May 20, 2009
- 147,405
- 70,601
- 2,330
If you really want your head to hurt -- there's been several real papers written and about 19 brawls broken out about debating this ancient artifact. Some jerks even use the mark to attempt to justify the IPCC estimates (modeling) of sea level rise since the 1800s.
Lot more complicated than taking a few pics and comparing. First of all, you'd have to match lunar cycles with the date the mark was set and get the proper interpretation of where it was put (high./mean/ low/ect).. And if the original guys "averaged" the mean observation over what period. Because the NATURAL variation in high or low tide exceeds the SLR since that period.
On top of it ALL --- the drama gets better. There was a major EARTHQUAKE changing the coast height by about 10cm.. Good luck with all that. I'm sure there's an answer. Let me know when you find it there Captain Blight.
Tasmanian Sea Levels - Lessons from the Isle of the Dead Real interesting reading. And there's a Part2 for those determined to figure out what all this means and where the bootie is buried.
...and the earthquake was caused by global warming
- Status
- Not open for further replies.
Similar threads
- Replies
- 211
- Views
- 2K
- Replies
- 20
- Views
- 348
- Replies
- 84
- Views
- 502
- Replies
- 54
- Views
- 882
Latest Discussions
- Replies
- 37
- Views
- 108
- Replies
- 146
- Views
- 754
Forum List
-
-
-
-
-
Political Satire 8625
-
-
-
-
-
-
-
-
-
-
-
-
-
-
-
-
-
-
-
ObamaCare 781
-
-
-
-
-
-
-
-
-
-
-
Member Usernotes 485
-
-
-
-
-
-
-
-
-
-