NOAA Satellite records second largest 2-month temperature drop in history

Oh my you go bananas, the fact that it is the second largest drop since 1979 triggers you into a babble fest, when you fail to realize that Dr. Spenser himself doesn't discount anything, he simply calls it a rare level of a drop nothing more. He doesn't pontificate on it at all, it is YOU who is trying inject something beyond what Dr. Spenser reported, which is unusually deep two month drop, that was his report, nothing more.

Third deviation level change you whine about is getting to be way out there...…

You need to slow down here......

Dr Spenser is wrong ... or he wouldn't have had some 14-year-old post this ... he would have had a refereed scientific journal publish this ... oh, except he couldn't call this "rare" in such a journal ... they don't allow weasel words ... they require actual standard deviation numbers ...

Normal as normal can be ... nothing unusual ...

ETA: These are the same standards I hold the Alarmists to ... why shouldn't I also hold my fellow Denialists to the same standard? ...

He is posting it on a public BLOG!

You are being irrational here, since NOT ONCE have you shown that his second largest drop in a two month time claim is false, you complain all around it. He made a simple observation, nothing more, you are attacking him for not being sciency enough, which is a dishonest argument you are making.

Did a bee get in your shirt?
 
The "NOAA satellite record"?

Even for Tommy (okay, for Watts, since Tommy is just parroting Watts), that's wildly dishonest, being that there is no such thing as the "NOAA Satellite record."

What Tommy is pushing here is the denier-created UAH temperature model, which only deniers still pay any attention to, being that it stinks so badly. UAH is wildly out of line with every other temperature record -- surface, weather balloons, satellites, everything. Normal people take that as an indication that UAH is wrong. Deniers do the cult thing where they declare that only the data that matches their sacred scripture is right, and all other data is wrong.

Normal people also point out that if you want to know the temperature at the surface, the best way is to take the temperature is at the surface with these amazing devices called "thermometers". Deniers tell you that it's better to measure microwaves generated across the entire column of the troposphere, run it through a model, and then apply numerous fudge factors until it says what you want.

That is, deniers reject the good clear data and embrace the bad fuzzy data, which is a clear sign of pseudoscience . Rational and honest people don't toss away the best data just because it disagrees with them. Deniers do.
 
Why don't all of you who worship at the altar of Climate Change,do the right thing and make the ultimate sacrifice for the cause....Kill yourselves.

Not all deniers are so openly genocidal, just most of them. Look at this guy, or Lucy, who is even more consumed by death-lust.

They're making it even more apparent now, with their "OLD PEOPLE AND SICK PEOPLE AND OTHER USELESS EATERS JUST NEED TO DIEDIEDIE SO THAT I CAN GO TO APPLEBEES AGAIN!" rants. They've always embraced eugenics, but at least they tried to hide it before. Not any more. They're all letting their eugenics freak flags fly high.
 
The "NOAA satellite record"?

Even for Tommy (okay, for Watts, since Tommy is just parroting Watts), that's wildly dishonest, being that there is no such thing as the "NOAA Satellite record."

What Tommy is pushing here is the denier-created UAH temperature model, which only deniers still pay any attention to, being that it stinks so badly. UAH is wildly out of line with every other temperature record -- surface, weather balloons, satellites, everything. Normal people take that as an indication that UAH is wrong. Deniers do the cult thing where they declare that only the data that matches their sacred scripture is right, and all other data is wrong.

Normal people also point out that if you want to know the temperature at the surface, the best way is to take the temperature is at the surface with these amazing devices called "thermometers". Deniers tell you that it's better to measure microwaves generated across the entire column of the troposphere, run it through a model, and then apply numerous fudge factors until it says what you want.

That is, deniers reject the good clear data and embrace the bad fuzzy data, which is a clear sign of pseudoscience . Rational and honest people don't toss away the best data just because it disagrees with them. Deniers do.

:cuckoo:

It is clear you can't address the topic itself, just another worn out attack on a data set is all you can do. It is clear you will always hate it no matter what because you made up your mind.

I only posted what Anthony Watts wrote, for his article, that is a standard requirement when you copy the headline and except from the article with a link back to the source of it.

RSS does the very same thing dumb ass, the difference is they use the older drifting satellites that have drift errors that needs to be.... modeled out. UAH uses the orbitally stable Aqua Satellite for the data.

ALL original Satellite data comes from the NOAA.

Your ignorance is unbroken, again.
 
Last edited:
Watts Up With That?

NOAA Satellite records second largest 2-month temperature drop in history

Anthony Watts

May 1, 2020

Excerpt:

In April, 2020, the Northern Hemisphere experienced its 2nd largest 2-month drop in temperature in the 497-month satellite record.

The Version 6.0 global average lower tropospheric temperature (LT) anomaly for April, 2020 was +0.38 deg. C, down from the March, 2020 value of +0.48 deg. C.

The Northern Hemisphere temperature anomaly fell from +0.96 deg. C to 0.43 deg. C from February to April, a 0.53 deg. C drop which is the 2nd largest 2-month drop in the 497-month satellite record. The largest 2-month drop was -0.69 deg. C from December 1987 to February 1988.
LINK

=====

CO2 effect doesn't show up on the chart below at all. :D

Here is a chart from HERE, Wood for Trees: Interactive Graphs

View attachment 330556

CO2 reading haven't changed, that's odd
Why is that odd to you?

What are the CO2 readings for the same period, 410, 411? yet temperature plummet. That's contrary to the "Theory" of Manmade Global Climate Warming Change, right?
 
Of course things are getting better. Humans aren't running around and crapping up the planet.

In India, they can again see the Himalaya's. In Venice, the water has cleared and the fish are starting to come back. LA has the best air quality they have ever had.
That was my thought also, that world wide during this shut down, we are putting less particulate into the air to catch/reflect sunlight and trap heat.

Hahaha....OMG.....no.... The Particulate count takes decades to change....lol....please try not to embarrass yourself. The Co2 concentrations have held steady which tells you all you need to know.

JO
OK, I'll be glad to listen to your theory. What ya got?

Do you understand the chart in post 1?
The chart appears to be raising trend of mean change of seawater temperature from 1979 to now. showing between .3 Deg C and a little over .5 Deg C between 1979 and 2020. Typical of trend chart used to make a case for global warming. Wasn't planning to getting sucked into global warming debate, as it is often not productive, time consuming, I am uncomfortable with methodology and data collection, and have no way personally verifyy the measurements used to project the trend lines.
Is that not a basic understanding of the chart?

The chart is from satellite data, the temperature data is also from Satellite data.

There is NO CO2 fingerprint in the water temperature data, but its warming trend runs parallel to temperature data.
Why do you key simply on CO2? I can assure you there was no appreciable change in CO2 during the 2 month period. to account for the anomaly you brought up. I don't think it is removed that fast.

Read this again,

The chart is from satellite data, the temperature data is also from Satellite data.

There is NO CO2 fingerprint in the water temperature data, but its warming trend runs parallel to temperature data.

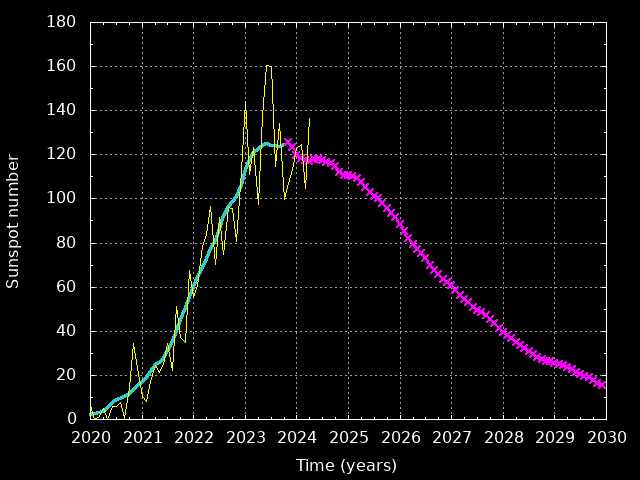
CO2 doesn't warm up the ocean waters, the SUN does that....
sunspot.png

Solar cycle 25 has begun.
We’re headed for a geomagnetic pole reversal and a micro nova. This will kill most of humankind and most other species on the planet. So, no need to worry about global warming.

micro nova?
 
There is NO CO2 fingerprint in the water temperature data,

What a bizarre thing to say. CO2 has gone up steadily. Ocean temps have gone ups steadily. Looks like a fingerprint to me.


And everyone knows air temps follow ocean temps. After all, the surface is 70% ocean. So why are you breathlessly posting a graph of how air temps follow ocean temps as if it's breaking news? Don't leave everyone guessing as to what your point is. State your point directly and clearly.

And since you say there isn't a fingerprint, what sort of hard evidence would make you say that there _is_ a fingerprint? Remember, if your "There's no fingerprint!" theory can't be disproved, it's not science, it's religion. So tell us what data could disprove it.
 
It is clear you can't address the topic itself,

Since you're so proudly screaming that you don't have a topic, that's a very curious accusation.

But I am addressing part of your topic, which is your deliberate cherrypicking of the single model that you can twist into agreeing with you, while you deliberately ignore all the data that doesn't.

I only posted what Anthony Watts wrote, for his article, that is a standard requirement when you copy the headline and except from the article with a link back to the source of it.

Honest people state a point directly and clearly, as I'm doing.

Propaganda pushers? They act like you do. They'll make vague insinuations, and then when challenged on them, they scream "WAAAA! YOU'RE SO MEAN! I'M JUST PRESENTING DATA!".

If you have a point, then make it. Tell us exactly why you're presenting the data, and what you say it means. Unless you can't, because you were just pushing some propaganda sleaze.

RSS does the very same thing dumb ass,

And the author of RSS states that for multiple reasons, the method is not useful for studying climate, and that RSS shouldn't be used for studying climate. That would be why we don't use it. Like I said, if you want to measure surface temperatures, the the non-insane way to do it is measure surface temperatures at the surface with thermometers.
 
Of course things are getting better. Humans aren't running around and crapping up the planet.

In India, they can again see the Himalaya's. In Venice, the water has cleared and the fish are starting to come back. LA has the best air quality they have ever had.

Please tell me that you are not so brainlessly stupid, as to think that in just 2 months, pollution of 100 years was wiped out.

Tell me, you are not that stupid.
Oh he is, he is.
 
Of course things are getting better. Humans aren't running around and crapping up the planet.

In India, they can again see the Himalaya's. In Venice, the water has cleared and the fish are starting to come back. LA has the best air quality they have ever had.
That was my thought also, that world wide during this shut down, we are putting less particulate into the air to catch/reflect sunlight and trap heat.

Hahaha....OMG.....no.... The Particulate count takes decades to change....lol....please try not to embarrass yourself. The Co2 concentrations have held steady which tells you all you need to know.

JO
OK, I'll be glad to listen to your theory. What ya got?

Do you understand the chart in post 1?
The chart appears to be raising trend of mean change of seawater temperature from 1979 to now. showing between .3 Deg C and a little over .5 Deg C between 1979 and 2020. Typical of trend chart used to make a case for global warming. Wasn't planning to getting sucked into global warming debate, as it is often not productive, time consuming, I am uncomfortable with methodology and data collection, and have no way personally verifyy the measurements used to project the trend lines.
Is that not a basic understanding of the chart?

The chart is from satellite data, the temperature data is also from Satellite data.

There is NO CO2 fingerprint in the water temperature data, but its warming trend runs parallel to temperature data.
Why do you key simply on CO2? I can assure you there was no appreciable change in CO2 during the 2 month period. to account for the anomaly you brought up. I don't think it is removed that fast.

Read this again,

The chart is from satellite data, the temperature data is also from Satellite data.

There is NO CO2 fingerprint in the water temperature data, but its warming trend runs parallel to temperature data.

CO2 doesn't warm up the ocean waters, the SUN does that....
sunspot.png

Solar cycle 25 has begun.
We’re headed for a geomagnetic pole reversal and a micro nova. This will kill most of humankind and most other species on the planet. So, no need to worry about global warming.

micro nova?
Look it up. It’s a thing.
 
1588441672807.png


Both the northern and southern oscillations are entering their cold phases and the sun is inactive. The drop will continue into next month, maybe longer by 3-9 years if we look at the 1970's progression. I'm betting by July we are at Zero anomaly or below.

CO2 will continue to rise and will lag the change to cooling for about 10-15 years. Given the high rate of temprature change, CO2 is not a significant driver of anything.
 
Both the northern and southern oscillations are entering their cold phases and the sun is inactive. The drop will continue into next month, maybe longer by 3-9 years if we look at the 1970's progression. I'm betting by July we are at Zero anomaly or below.

Billy, you've been predicting "NEW RECORD COLD LA NINA REAL SOON NOW" non-stop for at least the past 5 years.

Due to the "even a stopped clock is right twice a day" rule, you get a La Nina prediction right on rare occasions. But you're almost always dead wrong.

And meanwhile, the actual prediction is for a near-neutral ENSO for the next 6 months. And for 2020 to be possibly the warmest year ever, and definitely at least very close to the warmest year ever.
 
There is NO CO2 fingerprint in the water temperature data,

What a bizarre thing to say. CO2 has gone up steadily. Ocean temps have gone ups steadily. Looks like a fingerprint to me.


And everyone knows air temps follow ocean temps. After all, the surface is 70% ocean. So why are you breathlessly posting a graph of how air temps follow ocean temps as if it's breaking news? Don't leave everyone guessing as to what your point is. State your point directly and clearly.

And since you say there isn't a fingerprint, what sort of hard evidence would make you say that there _is_ a fingerprint? Remember, if your "There's no fingerprint!" theory can't be disproved, it's not science, it's religion. So tell us what data could disprove it.

How does atmospheric CO2 warm the deep ocean?
 
Both the northern and southern oscillations are entering their cold phases and the sun is inactive. The drop will continue into next month, maybe longer by 3-9 years if we look at the 1970's progression. I'm betting by July we are at Zero anomaly or below.

Billy, you've been predicting "NEW RECORD COLD LA NINA REAL SOON NOW" non-stop for at least the past 5 years.

Due to the "even a stopped clock is right twice a day" rule, you get a La Nina prediction right on rare occasions. But you're almost always dead wrong.

And meanwhile, the actual prediction is for a near-neutral ENSO for the next 6 months. And for 2020 to be possibly the warmest year ever, and definitely at least very close to the warmest year ever.

Year 2016 is nearly .60C warmer than now, you must he convinced there will be a huge El-Nino coming up, when YOU just said: "And meanwhile, the actual prediction is for a near-neutral ENSO for the next 6 months.", otherwise there couldn't be much warming coming up.
:cuckoo:
 
Both the northern and southern oscillations are entering their cold phases and the sun is inactive. The drop will continue into next month, maybe longer by 3-9 years if we look at the 1970's progression. I'm betting by July we are at Zero anomaly or below.

Billy, you've been predicting "NEW RECORD COLD LA NINA REAL SOON NOW" non-stop for at least the past 5 years.

Due to the "even a stopped clock is right twice a day" rule, you get a La Nina prediction right on rare occasions. But you're almost always dead wrong.

And meanwhile, the actual prediction is for a near-neutral ENSO for the next 6 months. And for 2020 to be possibly the warmest year ever, and definitely at least very close to the warmest year ever.
Empirical evidence continues to call you out a liar... Tell me how we get a massive -0.5 deg C rate of change while CO2 is still rising? Come on and show us how your magical gas is being overwhelmed and by what....
 
There is NO CO2 fingerprint in the water temperature data,

What a bizarre thing to say. CO2 has gone up steadily. Ocean temps have gone ups steadily. Looks like a fingerprint to me.


And everyone knows air temps follow ocean temps. After all, the surface is 70% ocean. So why are you breathlessly posting a graph of how air temps follow ocean temps as if it's breaking news? Don't leave everyone guessing as to what your point is. State your point directly and clearly.

And since you say there isn't a fingerprint, what sort of hard evidence would make you say that there _is_ a fingerprint? Remember, if your "There's no fingerprint!" theory can't be disproved, it's not science, it's religion. So tell us what data could disprove it.

CO2 doesn't warm the ocean water, that is why there can't me much of a CO2 fingerprint.

Most people understand why without difficulty, what is YOUR excuse?
 
Ha ha, it is clear you didn't read the article, I never originated the word unusual, it was written by Anthony Watts.

No that .53C drop in a two month period is actually unusual, which Dr. Spenser makes clear with his satellite data spanning 40 years, only one larger than that in a TWO month period, that was in 1987-88 time frame.

Here is why you are looking silly here:

The Version 6.0 global average lower tropospheric temperature (LT) anomaly for April, 2020 was +0.38 deg. C, down from the March, 2020 value of +0.48 deg. C.

The Northern Hemisphere temperature anomaly fell from +0.96 deg. C to 0.43 deg. C from February to April, a 0.53 deg. C drop which is the 2nd largest 2-month drop in the 497-month satellite record. The largest 2-month drop was -0.69 deg. C from December 1987 to February 1988
.

bolding mine

Notice the word ANOMALY?

You seem to be at war with Dr. Spenser, you are invited to tell him how wrong he is at his blog.

:D

You post it here ... you own it here ... if you can't back up your claims, then maybe you shouldn't have posted them here ...

This happens on average every 20 years ... if you'd have read the article, you'd have seen near the end some of the physics involved with this data ... and thus we see how normal and natural your click-bait is ...

It's stupid to say "497 months" instead of 41 years ... or it's deceptive ... you posted it, you own it ...
 
Last edited:

Forum List

Back
Top