eagle1462010
Diamond Member
- May 17, 2013
- 69,225
- 34,262
- 2,290
Not a problem. You can have them all. Take 2 for me.Please, dont take the vaccine.
Follow along with the video below to see how to install our site as a web app on your home screen.
Note: This feature may not be available in some browsers.
Not a problem. You can have them all. Take 2 for me.Please, dont take the vaccine.
The vaccines are a disaster and thus a "booster" within months of two shots.
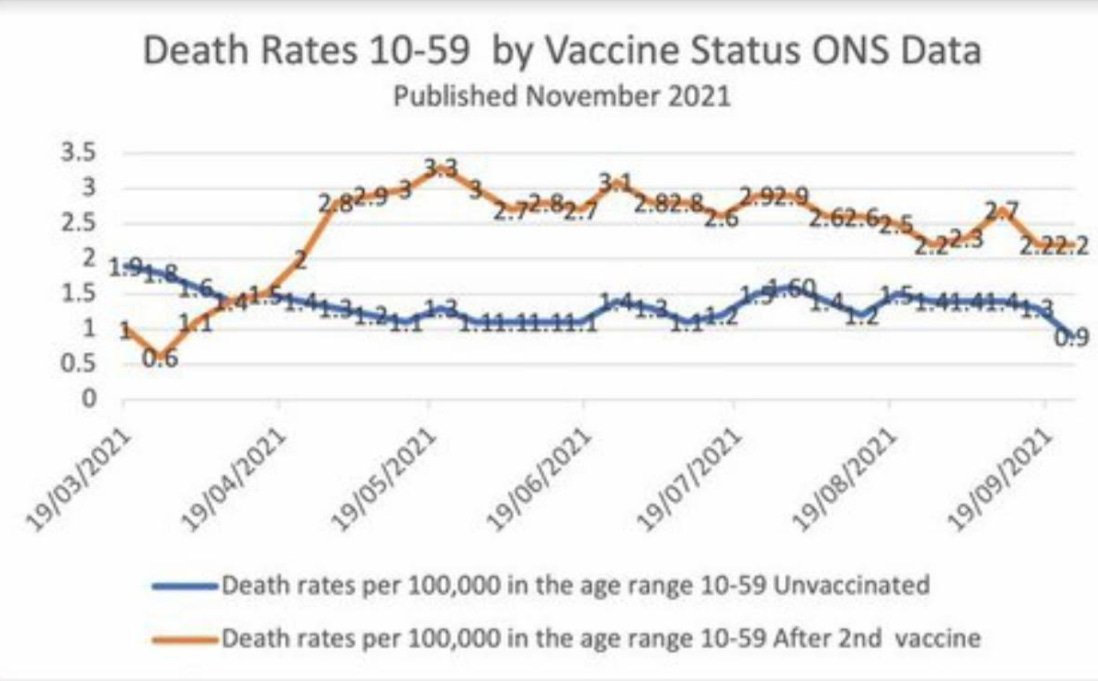
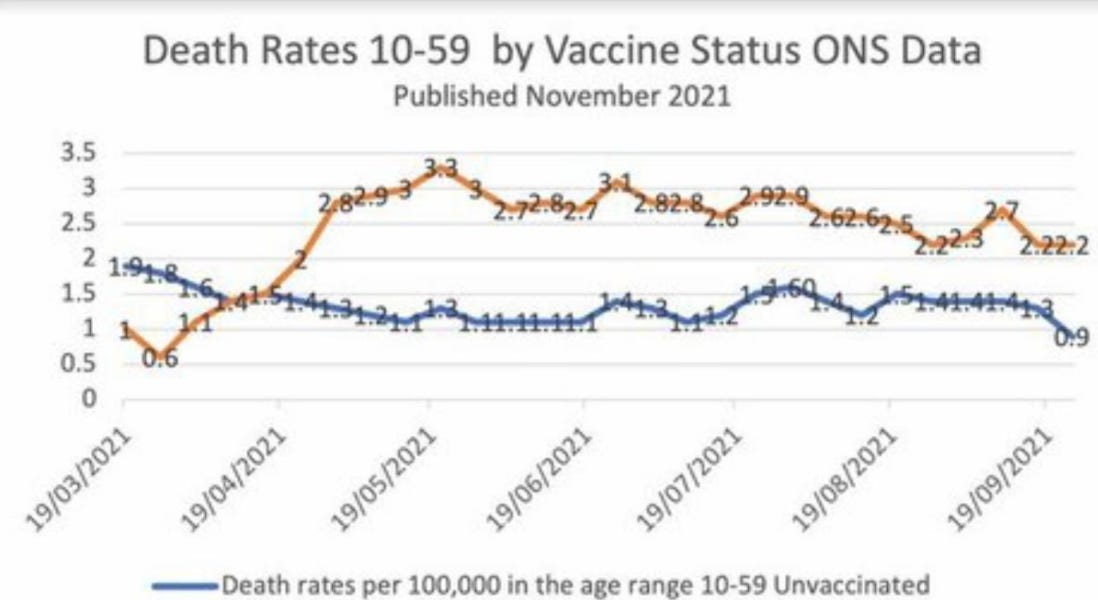
And have been for six months. This chart may seem unbelievable or impossible, but it's correct, based on weekly data from the British government.
The brown line represents weekly deaths from all causes of vaccinated people aged 10-59, per 100,000 people.The blue line represents weekly deaths from all causes of unvaccinated people per 100,000 in the same age range.
I have checked the underlying dataset myself and this graph is correct. Vaccinated people under 60 are twice as likely to die as unvaccinated people. And overall deaths in Britain are running well above normal.I don’t know how to explain this other than vaccine-caused mortality.The basic data is available here, download the Excel file and see table 4:Deaths by vaccination status, England - Office for National Statistics
Age-standardised mortality rates for deaths involving coronavirus (COVID-19), non-COVID-19 deaths and all deaths by vaccination status, broken down by age group.www.ons.gov.uk
Vaccinated English adults under 60 are dying at twice the rate of unvaccinated people the same age
And have been for six months. This chart may seem unbelievable or impossible, but it's correct, based on weekly data from the British government.alexberenson.substack.com
I believe it is Table 5, it breaks down the mortality risk to the exact age, and I averaged the mortality risk of the vaccinated verses the unvaccinated, The mortality risk of the vaccinated was higher than that of the unvaccinated, which clearly demonstrates my contention.It would be more informative if the age group was broken down to between 50 and 60.
I have a feeling that the disparity would not be too dissimilar because all-cause deaths in both groups are already heavily weighted in that same older category. Which would indicate that the vaccines are problematic.
The mortality risk of the vaccinated was higher than that of the unvaccinated
You’ll have to link me to that. All I have is the graph shown in the OP.I believe it is Table 5, it breaks down the mortality risk to the exact age, and I averaged the mortality risk of the vaccinated verses the unvaccinated, The mortality risk of the vaccinated was higher than that of the unvaccinated, which clearly demonstrates my contention.