Old Rocks
Diamond Member

The result;
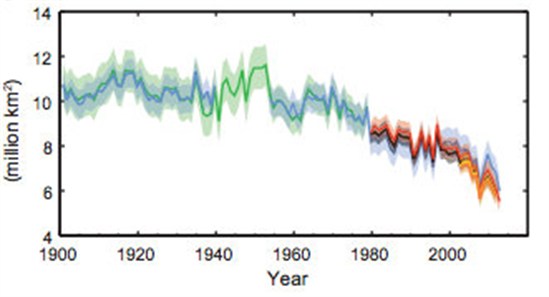
Figure 3. Monthly December ice extent for 1979 to 2017 shows a decline of 3.7 percent per decade.
Credit: National Snow and Ice Data Center
High-resolution image
Image 5 of 9 (play slideshow) Download

Arctic Sea Ice News and Analysis | Sea ice data updated daily with one-day lag
age 3 of 6 (play slideshow) Download

We have about a month and a half to make up for the presently low ice in the Arctic.