skookerasbil
Platinum Member
Lol....alarmists in here saying, "you deniers cherrypick!".....and in the next sentence point out specific areas where it is warmer!

Yeeeesh
Yeeeesh
Follow along with the video below to see how to install our site as a web app on your home screen.
Note: This feature may not be available in some browsers.
[
The feeble chart filled reply doesn't help him at all since it covers only a few decades at best (mostly from 1950 or 1970) while Dr. Spencer was talking about 118 years time frame.
In order, the charts I provided cover:
1950 - 2010, 60 years, SST v Power Dissipation
1970 - 2004, 34 years, Number of Hurricanes v Wind Speed
1880 - 2010, 130 years, Tropical Storm and Hurricane Numbers v Year
1970 - 2012, 42 years, Tropical Storm and Hurricane Numbers v Season
1850 - 2010, 160 years, Global Average Sea Surface Temperature v Year
1925 - 2005, 80 years, Frequency of N Atlantic Tropical Storms v Year
1950 - 2014, 64 years, N Atlantic ACE Index v Year
Two of these charts exceed Spencer's time frame and the seven charts combined provide 570 years worth of data and the set provides several times as many relevant and independent variables. I'm sure I could find charts that dates back to the beginning of the Holocene, but if you think that's what produces meaningful data concerning the current situation, you need to go back to school.
[
Crick is full of Crock as usual.
I don't know if I can continue to debate someone with a mind capable of producing a quip that...
And you intent is that all that read that assume that goes for the whole Atlantic basin. This is not my first rodeo, asshole.
 who can't read the obvious TITLE of the article:
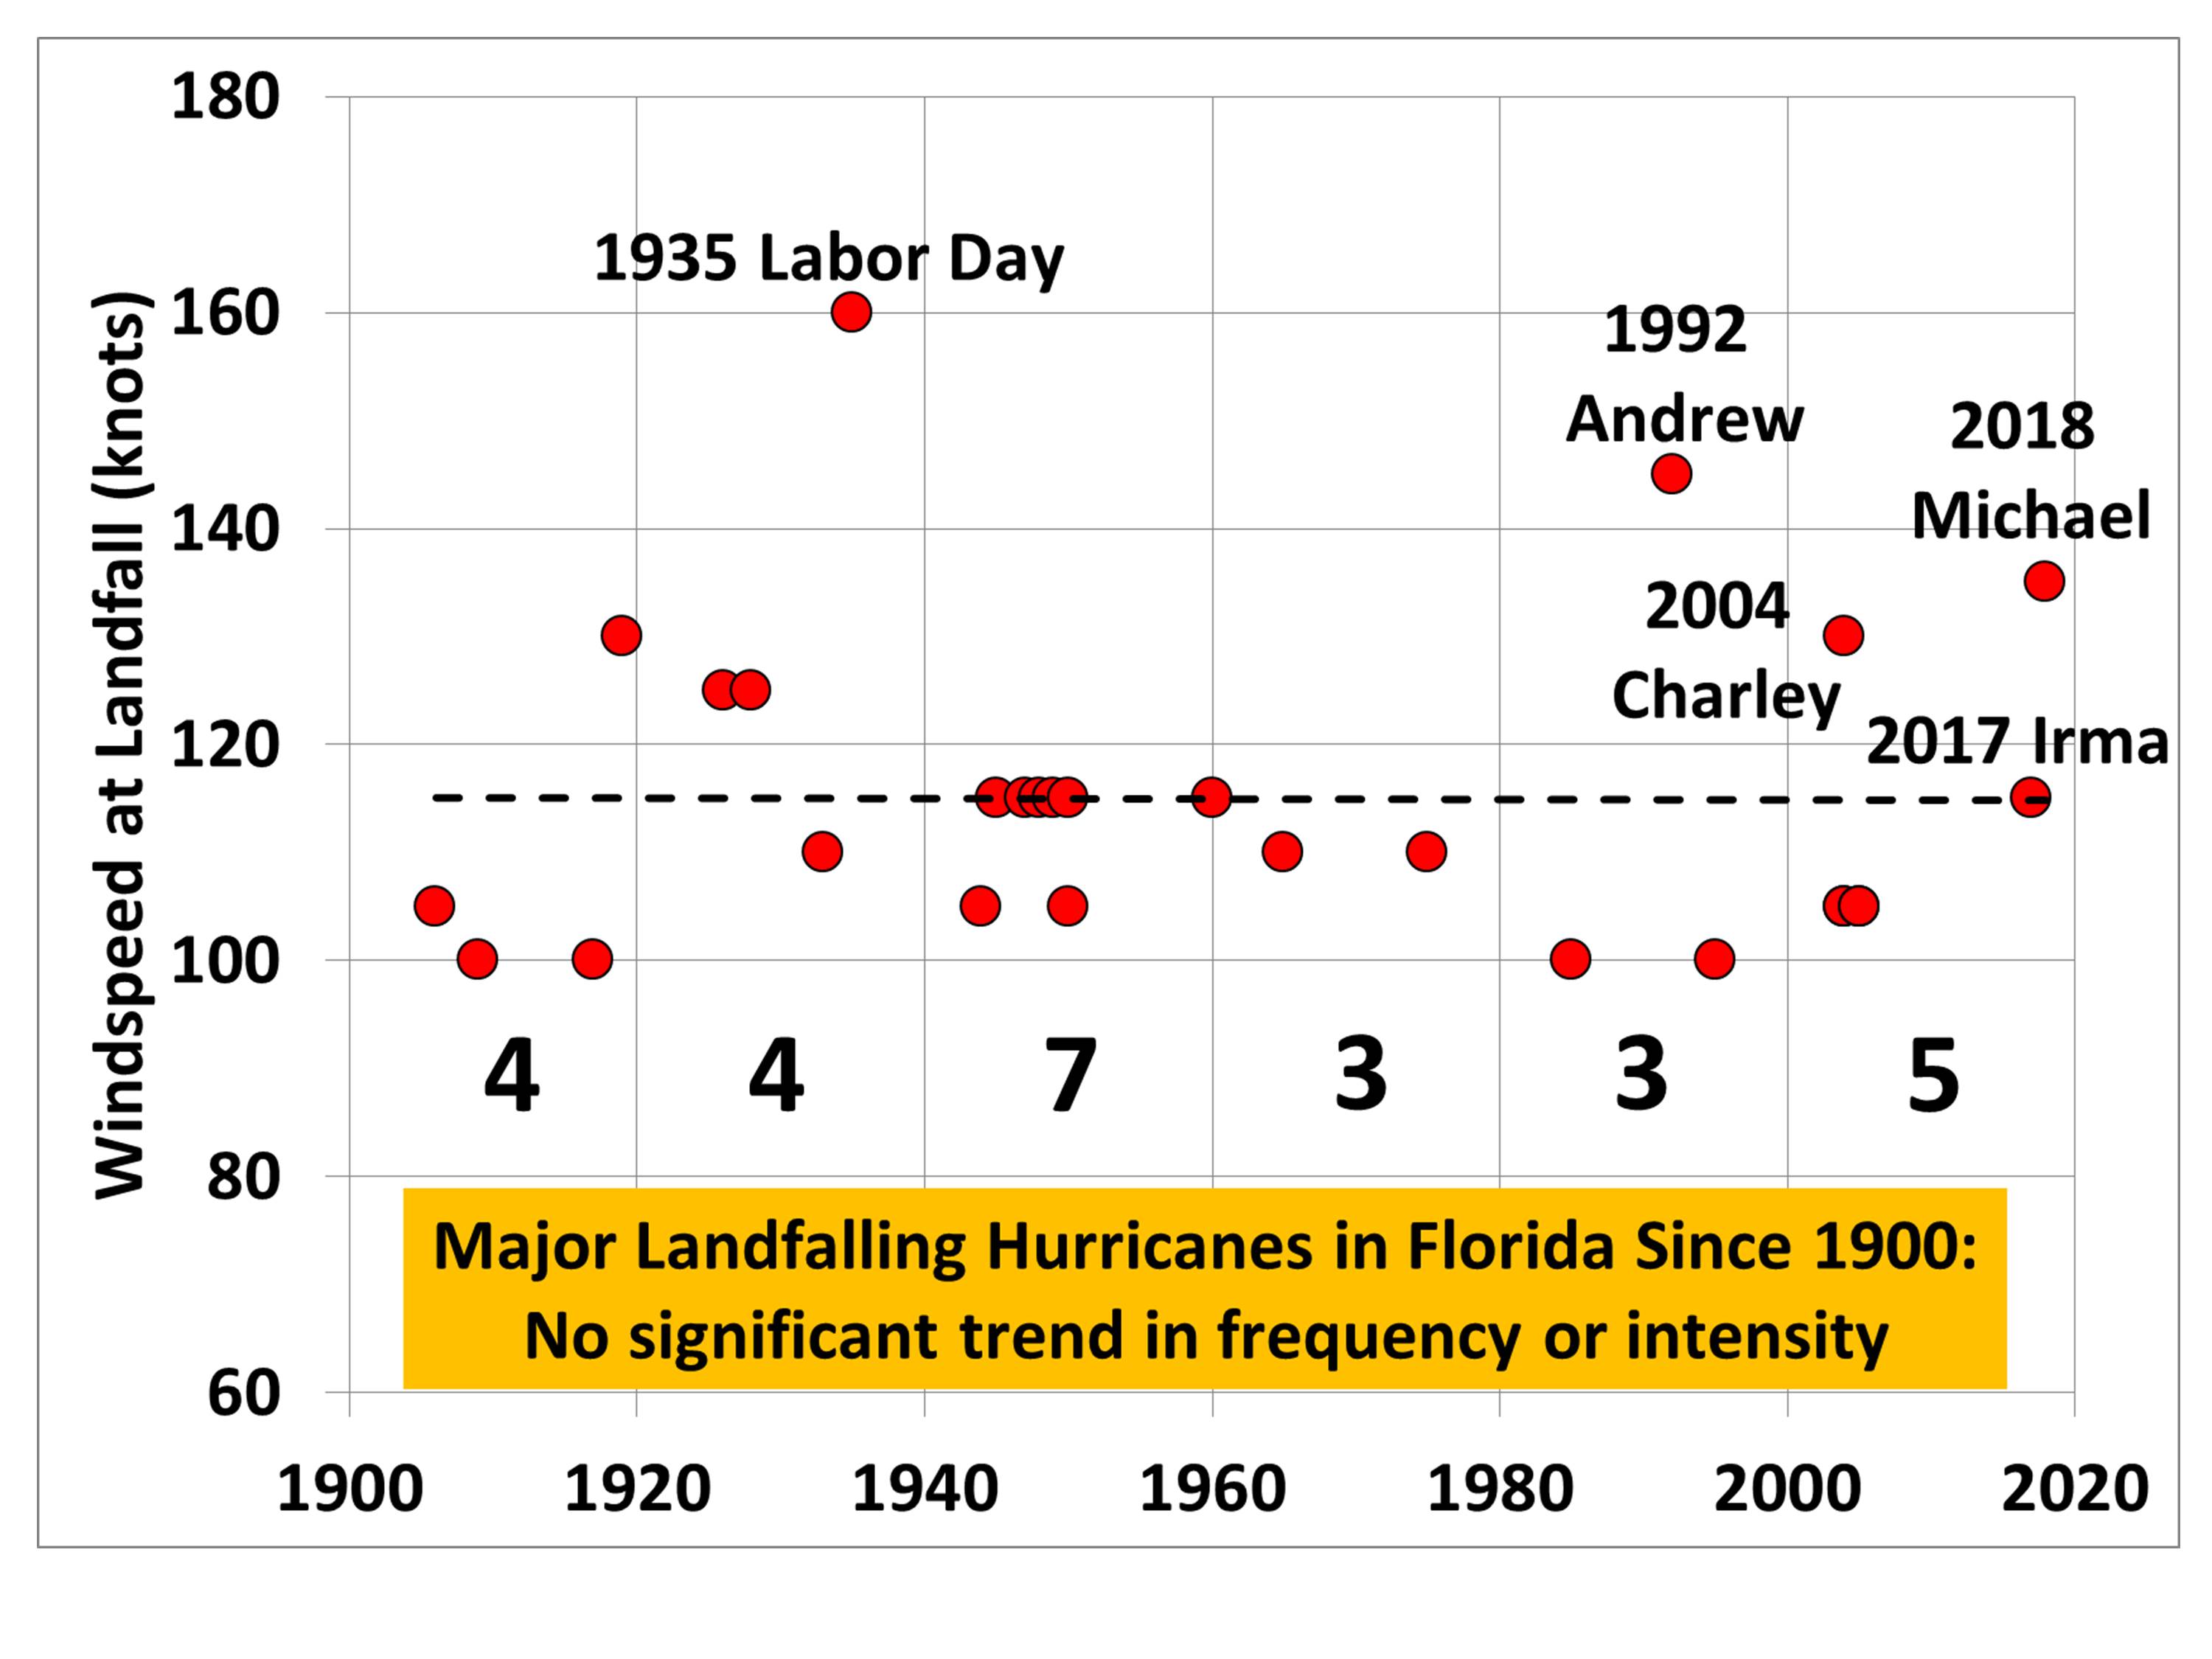
And Florida does not represent the whole of the Atlantic basin. And that is exactly what you are dishonestly trying to imply. Sorry, your stupid game is transparent.
who can't read the obvious TITLE of the article: