Official Coronavirus Thread - Up to the minute Coronavirus map and count.

Just out of curiosity, let's see how we're doing compared to our two closest neighbors.

Total Deaths

USA: 65,776
Canada: 3,391
Mexico: 1,972

Total Cases

USA: 1,131,492
Canada: 55,061
Mexico: 20,739

Total Deaths per 1 million people

USA: 199
Canada: 90
Mexico: 15

Total Cases per 1 million people

USA: 3,418
Canada: 1,459
Mexico: 161

Tests per 1 million people

USA: 20,241
Canada: 22,050
Mexico: 707

Interesting to see that we're last in almost every category. Mexico has less tests per capita. Take from it what you will.

Mexico (and central America generally as well as the Caribbean) have had very little CV action until just recently.
Possibly because of lack of testing.

Not much testing, but by "CV action" I mean both cases AND deaths. There hasn't been much of either, ergo there wasn't any haste for testing.
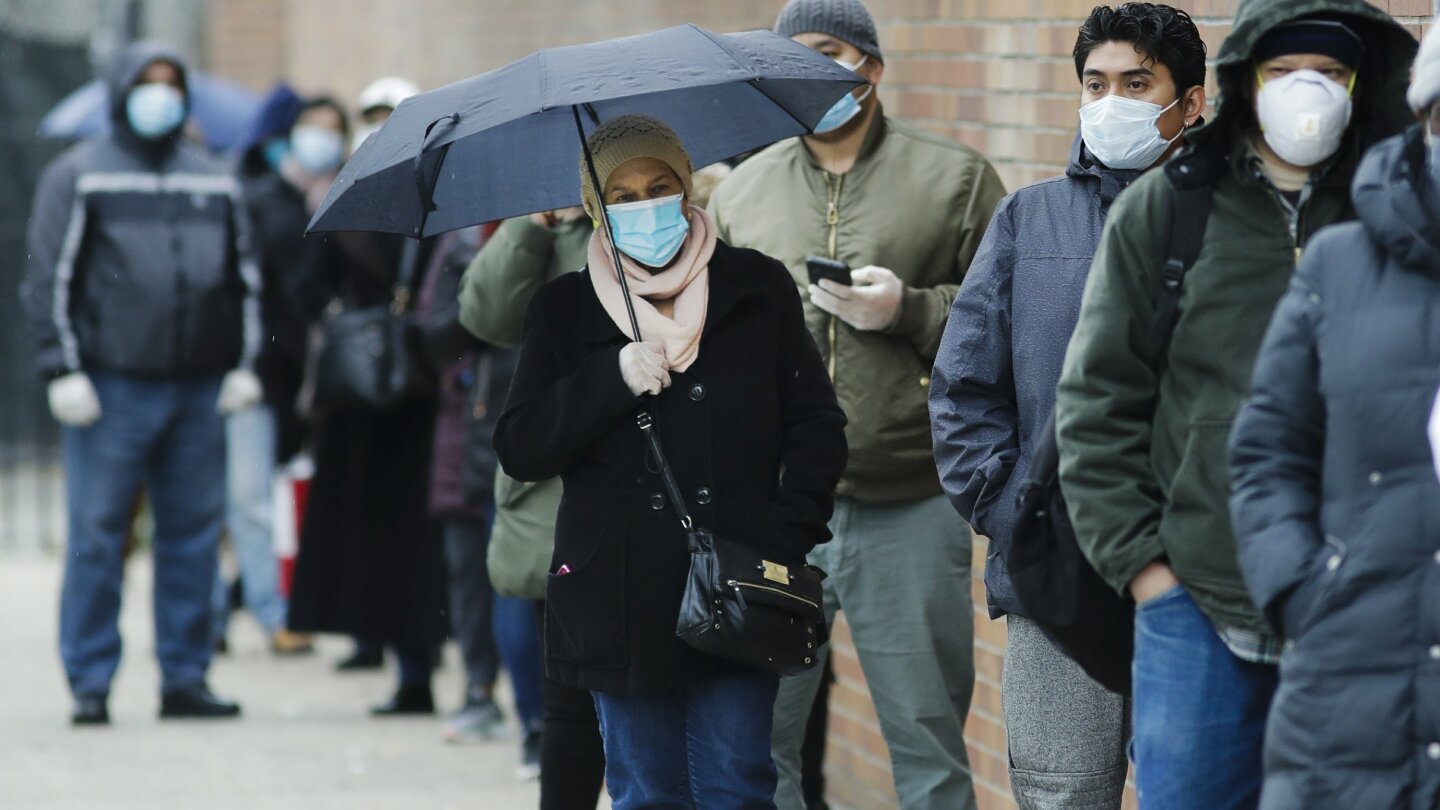
Testing sites are mostly empty because no one is sick
Well thats a freakish lie...."sarah" ....
 
Never revised downward?

I don't think you're understanding what he's saying.

In order to show that they revised it downward, you will need to do the following:

- Show what it was before.
- Show what it is now.
- Show that the "now" number is less than the "before" number.

The before and after shows that it was revised. If the new number is less than the old number, then that shows that it was revised downward.

Hope that helps. Good luck.

Official numbers we're seeing every day are now over 60k deaths and those numbers are coming from CDC.
CDC chart on their website suddenly is showing 37k deaths.

If CDC website number is right, than all other numbers are not, then CDC revised their number downward and everyone else should update their numbers.

I tried.

I've tried too.

OK, answer this... which number is right? CDC website number, or worldometer number that get the count from CDC?

The difference was already explained.

Sorry man, but you're going to have to meet me halfway here. I don't think I'm capable of simplifying these things any more than what has already been explained to you. If you're still not understanding it, then maybe someone more patient than me will help you with it.
 
Brazil and Russia, soaring fast. Not quite at our pace yet but leaving others behind. Both have now passed Iran, China and Canada. The two had the second (Russia) and fourth (Brasil) most new cases after the US, with the UK in between them.

Country,
Other
Total
Cases
New
Cases
Total
Deaths
New
Deaths
Total
Recovered
Active
Cases
Serious,
Critical
Tot Cases/
1M pop
Deaths/
1M pop
Total
Tests
Tests/
1M pop
World3,481,351+83,257244,663+5,2151,120,9082,115,78050,86044731.4
USA1,160,774+29,74467,444+1,691173,318920,01216,4753,5072046,931,13220,940
Spain245,567+2,58825,100+276146,23374,2342,3865,2525371,528,83332,699
Italy209,328+1,90028,710+47479,914100,7041,5393,4624752,108,83734,879
UK182,260+4,80628,131+621N/A153,7851,5592,6854141,129,90716,644
France168,396+1,05024,760+16650,56293,0743,8272,5803791,100,22816,856
Germany164,967+8906,812+76129,00029,1552,1051,969812,547,05230,400
Turkey124,375+1,9833,336+7858,25962,7801,4451,475401,111,36613,177
Russia124,054+9,6231,222+5315,013107,8192,30085083,945,51827,036
Brazil96,559+4,4506,750+34040,93748,8728,31845432339,5521,597
Iran96,448+8026,156+6577,35012,9422,7871,14873484,5415,769
China82,875+14,63377,68555737583
Canada56,714+1,6533,566+17523,80129,3475571,50394832,22222,050

 
TOTAL NUMBER AND DAILY RATE OF INCREASE IN CORONAVIRUS INFECTIONS BY DATE:

March 24, 2020 - United States - 54,916
March 25, 2020 - United States - 68,489 - 24.7% increase
March 26, 2020 - United States - 85,594 - 24.97% increase
March 27, 2020 - United States - 104,256 - 21.8% increase
March 28, 2020 - United States - 123,776 - 18.7% increase
March 29, 2020 - United States - 142,224 - 14.9% increase
March 30, 2020 - United States - 164,266 - 15.5% increase
March 31, 2020 - United States - 188,578 - 14.8% increase
April 1, 2020 - United States - 215,300 - 14.2% increase
April 2, 2020 - United States - 245,193 - 13.9% increase
April 3, 2020 - United States - 277,475 - 13.2% increase
April 4, 2020 - United States - 311,635 - 12.3% increase
April 5, 2020 - United States - 336,830 - 8.1% increase
April 6, 2020 - United States - 367,629 - 9.1% increase
April 7, 2020 - United States - 400,540 - 9.0% increase
April 8, 2020 - United States - 435,160 - 8.6% increase
April 9, 2020 - United States - 468,895 - 7.8% increase
April 10, 2020 - United States - 502,876 - 7.3% increase
April 11, 2020 - United States - 533,115 - 6.0% increase
April 12, 2020 - United States - 560,433 - 5.1% increase
April 13, 2020 - United States - 587,155 - 4.8% increase
April 14, 2020 - United States - 614,246 - 4.6% increase
April 15, 2020 - United States - 644,089 - 4.9% increase
April 16, 2020 - United States - 678,144 - 5.3% increase
April 17, 2020 - United States - 710,272 - 4.7% increase
April 18, 2020 - United States - 738,923 - 4.0% increase
April 19, 2020 - United States - 764,265 - 3.4% increase
April 20, 2020 - United States - 792,913 - 3.8% increase
April 21, 2020 - United States - 819,175 - 3.3% increase
April 22, 2020 - United States - 849,092 - 3.7% increase
April 23, 2020 - United States - 886,709 - 4.4% increase
April 24, 2020 - United States - 925,758 - 4.4% increase
April 25, 2020 - United States - 960,896 - 3.8% increase
April 26, 2020 - United States - 987,322 - 2.8% increase
April 27, 2020 - United States - 1,010,507 - 2.4% increase
April 28, 2020 - United States - 1,035,765 - 2.5% increase
April 29, 2020 - United States - 1,064,572 - 2.8% increase
April 30, 2020 - United States - 1,095,210 - 2.9% increase
May 1, 2020 - United States - 1,131,492 - 3.3% increase
May 2, 2020 - United States - 1,160,838 - 2.6% increase


TOTAL NUMBER AND DAILY RATE OF INCREASE IN CORONAVIRUS DEATHS BY DATE:

March 26, 2020 - United States - 1,000
April 6, 2020 - United States - 10,000 - 900% increase
April 19, 2020 - United States - 40,000 - 300% increase
April 23, 2020 - United States - 50,243 - 25.6% increase
April 24, 2020 - United States - 52,217 - 3.9% increase
April 25, 2020 - United States - 54,265 - 3.9% increase
April 26, 2020 - United States - 55,415 - 2.1% increase
April 27, 2020 - United States - 56,803 - 2.5% increase
April 28, 2020 - United States - 59,266 - 4.3% increase
April 29, 2020 - United States - 61,669 - 4.1% increase
April 30, 2020 - United States - 63,861 - 3.6% increase
May 1, 2020 - United States - 65,776 - 3.0% increase
May 2, 2020 - United States - 67,448 - 2.5% increase
 
The Northeast, Michigan and states around her contributed the majority of deaths.

New York's cases were 1% of their total cases so far. Not bad.

South Dakota throws a zero staying at 21. Not bad for a Hot Spot
 
Never revised downward?

I don't think you're understanding what he's saying.

In order to show that they revised it downward, you will need to do the following:

- Show what it was before.
- Show what it is now.
- Show that the "now" number is less than the "before" number.

The before and after shows that it was revised. If the new number is less than the old number, then that shows that it was revised downward.

Hope that helps. Good luck.

Official numbers we're seeing every day are now over 60k deaths and those numbers are coming from CDC.
CDC chart on their website suddenly is showing 37k deaths.

If CDC website number is right, than all other numbers are not, then CDC revised their number downward and everyone else should update their numbers.


The cdc 37k from corona

They have another group pneumonia/covid death

They dont clarify if the pneumonia developed due to covid
We'll be generous Say half that number developed pneumonia due to contracting the dirty chink bug

They're still way off 60 k
Look at all other categories and expected death rate
97 % of all these deaths were expected

They're the experts after all :p:D

The leftest useful idiots still carrying on are just pathetic
 
1588070540417.png


81NA7qwa.jpeg
 
I keep reading posters here yacking about population density when explaining New York.

But New York isn't even on the top 10.

Those top 10 cities don'tseem to be having any issues.
 
I keep reading posters here yacking about population density when explaining New York.

But New York isn't even on the top 10.

Those top 10 cities don'tseem to be having any issues.
Cause it's all bullshit and Cuomo and deblazio are fucking ghouls

They sent smallpox blankets to the old folks home ...pretty much ...unfriggin real
Humm what could they possibly expect to happen
 
Look at the data. Worldometer reports 75.3% of COVID-19 deaths were due to underlying conditions. From their own website:

"Patients who reported no pre-existing ("comorbid") medical conditions had a case fatality rate of 0.9%. Pre-existing illnesses that put patients at higher risk of dying from a COVID-19 infection are:

View attachment 330958

Also, CDC admits on their website that sudden explosion of COVID-19 deaths in April appears to be result of taking death numbers away from pneumonia and influenza and re-classifying them as COVID-19.

And this is from CDC website, read the small print, if you will.

"The number of hospitalizations estimated so far this season is lower than end-of-season total hospitalization estimates for any season since CDC began making these estimates."

The estimates were to have 500,000 of hospitalization for entire flu season, but in reality the number of hospitalizations were less than a half of that, which happened before COVID-19. They were on the track of their estimates, and suddenly "they stopped counting"?

No, they still counted those hospitalizations, but reassigned them as COVID-19, most likely for financial incentives offered to hospitals and doctors. Why did CDC issued billing coding for hospitals to follow for COVID-19 which literally bribed doctors and hospitals to up-code normal pneumonia cases to COVID-19 cases which were reimbursed at three-fold higher rate?

So, either influenza simply vanished from the face of the planet when corona virus begun, or someone is simply lying.

A lot of people who would normally go to the hospital for check ups or to be hospitalized overnight as a precaution has dropped do to the fear of the spread of COVID-19. So national hospitalizations are not really the right yard stick to be measuring this pandemic.

A proper yardstick would be Funeral Homes, Morgues, crematoriums, and cemeteries. In New York City, these business's are overwhelmed. There are far too many dead people to handle. Bodies are being sent to upstate New York to crematoriums. Crematoriums are running round the clock burning bodies in New York City, just like in Wuhan China back in January. Some of the ovens are breaking down do to the overuse. In some places in New York City there are bodies stacked in trucks outside these business's.

I'll never understand why anyone would do their utmost to make light of this global disaster. This is a pandemic, and were only at the start of it. We've learned so little in 100 years since the last pandemic as a global society. Its irresponsible to be making the same mistakes people made 100 years ago.
 
I keep reading posters here yacking about population density when explaining New York.

But New York isn't even on the top 10.

Those top 10 cities don'tseem to be having any issues.

You have to be penetrated first by the pathogen to an extensive degree. Once that happens, is when the role of population density starts to take effect.

TAIWAN has the 12th highest population density of any country on the planet. Yet, they only have 432 infections and 6 deaths. No one has died in Taiwan from coronavirus since April 10, 2020. What produced these remarkable results? Banning and severely restricting travel and entry into the country on January 20, 2020 from ANYWHERE by ANYONE! That was BEFORE there was even ONE confirmed case of coronavirus in TAIWAN.

The first key in fighting a pandemic is PREVENTING PENETRATION into the population. TAIWAN achieved that because they acted on January 20, 2020. It took Trump another two months to put in place the same travel bans and restrictions that TAIWAN put in place on January 20, 2020.
 
I keep reading posters here yacking about population density when explaining New York.

But New York isn't even on the top 10.

Those top 10 cities don'tseem to be having any issues.

Here are the states listed in order of population density.

1. New Jersey (2nd highest infection rate)
2. Rhode Island (4th highest infection rate)
3. Massachusetts (3rd highest infection rate)
4. Connecticut (5th highest infection rate)
5. Maryland (10th highest infection rate)
6. Delaware (6th highest infection rate)
7. New York (highest infection rate)

The North East is highly dense and it's also highly infected. I don't think it's unreasonable to see that those two factors can be closely connected once the virus starts spreading.

I decided to look further into this with all the states. I took each state's population density (population per square mile) compared to their infection rate (cases per 1 million people). The Pearson's correlation coefficient between those two factors is 0.77. This indicates at least a moderate to strong positive correlation between population density and infection rate among states. I haven't looked into this among cities yet.
 
Many states have fallen short of testing thresholds set up by "federal government and recommended by a variety of public health researchers."

"Three months into an unprecedented public health emergency, the White House has largely resisted calls for a coordinated plan to conduct the millions of tests experts say are needed to contain the virus. What federal officials outlined recently isn’t even an official benchmark, and AP’s analysis found that a majority of states are not yet meeting it.

With no specific guidelines, states are left to figure out what a successful testing program should be while they simultaneously try to reopen their shattered economies. If states don’t have robust testing, public health experts say they will be unable to detect outbreaks quickly enough to contain them, which could lead to more shutdowns."

This is a colossal fail of the FDA and their rules set up by the Obama Administration as there won't be any benchmarks to testing. Google has failed in their testing. We are in uncharted waters here as the public seems to be taking the hint from POTUS Donald Trump to open the economy.

 
I keep reading posters here yacking about population density when explaining New York.

But New York isn't even on the top 10.

Those top 10 cities don'tseem to be having any issues.

Here are the states listed in order of population density.

1. New Jersey (2nd highest infection rate)
2. Rhode Island (4th highest infection rate)
3. Massachusetts (3rd highest infection rate)
4. Connecticut (5th highest infection rate)
5. Maryland (10th highest infection rate)
6. Delaware (6th highest infection rate)
7. New York (highest infection rate)

The North East is highly dense and it's also highly infected. I don't think it's unreasonable to see that those two factors can be closely connected once the virus starts spreading.

I decided to look further into this with all the states. I took each state's population density (population per square mile) compared to their infection rate (cases per 1 million people). The Pearson's correlation coefficient between those two factors is 0.77. This indicates at least a moderate to strong positive correlation between population density and infection rate among states. I haven't looked into this among cities yet.

Aren't these all Democrat run and liberal states?

ETA: In even Democrat run California, the plan is in place to open businesses and restaurants. I saw a few local shops open for business, but not restaurants.
 
Last edited:

Forum List

Back
Top