The Reality of Man Made Global Warming Shows Up In Michigan.

We were exiting the Little Ice Age at the start of the industrial revolution.. SO your claiming that all of the warming is man made when it is easily shown to be natural variation?

The only "coincidence" is the fact we have just left an active solar phase (which created the increased heat) and our warming is coming to an end..

What little ice age are you talking about. There have been at least a few in historical times. And for those that did happen, could something like the eruption of Krakatoa have anything to do with it?
Running in circles with sharp objects are you?

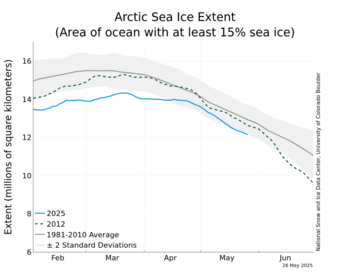
View attachment 108730

I guess you missed this... Its called scientific evidence..

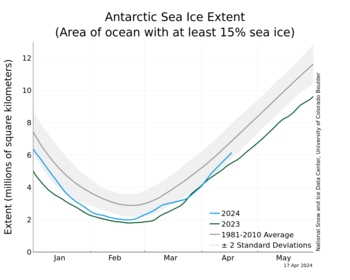
Your evidence is bullshit that has little to do with the present day. I have a similar graph that I will show you.
d3cdhbp.jpg
Tell me you ignorant little dumb fuck, tell me why the earth didn't runaway with heat 400 million years ago? According to your fantasy religion it should have went up in a ball of flame and never returned.. Tell me how the earth glaciated over and over again with levels of CO2 above 4,000ppm..

The Null Hypothesis shows your religious belief a fraud and a lie.. Your own graph shows you an ignorant little fool who has no concept of science or how its done correctly..

Try asking me the question in a non-queerbait manner and maybe I will tell you.

LOL

You've lost the battle.. Your not worth my time.. I cant fix your kind of stupid..
 
But what went on does not matter ?

The earth's climate has been moving for millions of years, but you confine your analysis to what....100 years ?

What do you do when you go to bed after a 50 F day and wake up to snow.......blame it on....????
 
Yeah. Tens of millions of years ago. With the continents in different places.

Try a few hundred, genius

According to a website by usatoday, the last time the earth was this warm was 125,000 years ago.


Which is a crock of poo. Over 100 peer reviewed studies show that the Medieval Warming Period was global, and at least two degrees warmer than today. The Holocene Climate Optimum of 8,000 years ago was FIVE degrees warmer than today. I don't know who you are listening too but they don't know squat.

Some time ago I heard somebody else say that the last time the earth was this hot was around 65,000 years ago. Or maybe it was the last time CO2 levels were this high. I don't remember. But you forced me to look at the internet again. This time, I looked at the FIRST website. It said that the last time the earth was this hot was 130,000 years ago. I am tired of looking up websites to prove you wrong. Believe what you will.

LOL..

You cant even identify the normal cyclical variation of earths warm and cold cycles..

View attachment 108736

Cycles of 90,000 of glaciation followed by 12,000-16,000 years of warm called INTERGLACIALS.. Our current one is 14,600 years long already..

I have to laugh about the warming your so worried about.. Its all been seen before and its natural..

Very interesting graphs...what caused the CO2 levels to tank like that ?
CO2 lags temperature by 200-800 years. The reasons are many. Foliage increases with temp and plant matter degradation (normal cycle) releases CO2, Ocean warming releases sequestered CO2, and the list goes on and on..It takes time for CO2 to increase and it takes time for CO2 to decrease as foliage decreases and oceans cool and uptake.

IT ALL LAGS TEMP.. It never drives the temperature.
 
Last edited:
Seriously? You "heard" something? Get real silly boy. We don't go by ridiculous hearsay. I don't like wiki but it seems to be the max level of your comprehension..


The Holocene Climate Optimum warm event consisted of increases of up to 4 °C near the North Pole (in one study, winter warming of 3 to 9 °C and summer of 2 to 6 °C in northern central Siberia).[1] The northwest of Europe experienced warming, while there was cooling in the south.[2] The average temperature change appears to have declined rapidly with latitude so that essentially no change in mean temperature is reported at low and middle latitudes. Tropical reefs tend to show temperature increases of less than 1 °C; the tropical ocean surface at the Great Barrier Reef ~5350 years ago was 1 °C warmer and enriched in 18O by 0.5 per mil relative to modern seawater.[3] In terms of the global average, temperatures were probably colder than present day (depending on estimates of latitude dependence and seasonality in response patterns). While temperatures in the Northern Hemisphere were warmer than average during the summers, the tropics and areas of the Southern Hemisphere were colder than average.[4]

Holocene climatic optimum - Wikipedia

First, what I "heard" is apparently better than what you think you know. Next, it is interesting how you skirt around making sense. Just on the edges, but not quite there. Even "IF" what you say is true, (which I doubt) it is known that global warming effects the poles more. Next, you say that over 5000 years ago, water temperatures at the great barrier reef were one degree warmer than they are now. But right now, that reef is dying. One degree warmer and there wouldn't have been a reef. At least not a living one. Next, all of what you are saying is basically meaningless anyway. Because no natural process has caused CO2 levels to rise at the speed they are. And that as you know is to the tune of 26.8 billion tons of CO2 each year created by humans. That of course doesn't include the methane we are also responsible for. Which is around 100 times worse.
:blahblah::blahblah::blahblah:

"i heard" now trumps science and scientists...:dig:
 
Seriously? You "heard" something? Get real silly boy. We don't go by ridiculous hearsay. I don't like wiki but it seems to be the max level of your comprehension..


The Holocene Climate Optimum warm event consisted of increases of up to 4 °C near the North Pole (in one study, winter warming of 3 to 9 °C and summer of 2 to 6 °C in northern central Siberia).[1] The northwest of Europe experienced warming, while there was cooling in the south.[2] The average temperature change appears to have declined rapidly with latitude so that essentially no change in mean temperature is reported at low and middle latitudes. Tropical reefs tend to show temperature increases of less than 1 °C; the tropical ocean surface at the Great Barrier Reef ~5350 years ago was 1 °C warmer and enriched in 18O by 0.5 per mil relative to modern seawater.[3] In terms of the global average, temperatures were probably colder than present day (depending on estimates of latitude dependence and seasonality in response patterns). While temperatures in the Northern Hemisphere were warmer than average during the summers, the tropics and areas of the Southern Hemisphere were colder than average.[4]

Holocene climatic optimum - Wikipedia

First, what I "heard" is apparently better than what you think you know. Next, it is interesting how you skirt around making sense. Just on the edges, but not quite there. Even "IF" what you say is true, (which I doubt) it is known that global warming effects the poles more. Next, you say that over 5000 years ago, water temperatures at the great barrier reef were one degree warmer than they are now. But right now, that reef is dying. One degree warmer and there wouldn't have been a reef. At least not a living one. Next, all of what you are saying is basically meaningless anyway. Because no natural process has caused CO2 levels to rise at the speed they are. And that as you know is to the tune of 26.8 billion tons of CO2 each year created by humans. That of course doesn't include the methane we are also responsible for. Which is around 100 times worse.


Big whoop. The atmosphere weighs QUADRILLIONS of tons. You clearly have no clue what you are blabbering about. When the reef was formed the temps were 10 degrees warmer than they are now. You idiots bleat about all these horrible things that will happen but when they have happened before nothing bad happened. Go away junior. You're waaaay out of your league.
 
What little ice age are you talking about. There have been at least a few in historical times. And for those that did happen, could something like the eruption of Krakatoa have anything to do with it?


He's referring to the one that came to an end in 1850. All of the warming we have experienced since then is taking us back UP to where we used to be.

It doesn't matter. He and you are still full of crap. Why not tell me more about how the earth used to be a lot hotter a billion years ago.

History and science back us up. Not you. You can call us all the names you wish but the reality is there IS no scientific support for the AGW theory. That is a fact. Your silly name calling isn't.

Like it or not, your "science" is fools science. I have heard it said that if you took an average size globe and put a coat of varnish on it, the thickness of the varnish would be a pretty good approximation of thickness of the earth's atmosphere. And each year, humans are responsible for releasing 26.8 billion tons of CO2 into it. That has to and is having an effect.


Wrong. I suggest you look up the term "pseudo science" And look up the term "non falsifiable". Both of those terms fit AGW "theory" to a T. But that's real science and real science scares you religious nutters.
I believe the term you're probably looking for here is "non-replicable". For instance, some of most often cited pseudoscience papers regarding climatology such as the infamous Michael Mann, Raymond Bradley and Malcolm Hughes papers originally published in 1998 and 1999 that were subsequently published by the Intergovernmental Panel on Climate Change. They introduced the now thoroughly debunked hockey shtick chart to the general public that was considered by actual scientists to be non-replicable because the authors very suspiciously refused to release either the data or the computer code that they used to produce their strange and previously unheard of hockey shtick chart.

Another egregious example is a psuedoscientific paper written by Phil Jones and Wei-Chung Wang which was published in 1990 regarding the "urban heat island" effect. This is another one of the most often cited papers in the field of climatology. And it is another paper which lacked data in the SI. When pushed on the issue Wang claimed to have lost the data from weather stations in rural eastern China. (The classic dog ate my homework excuse).

After WikiLeaks released the damning climategate emails it became obvious that these were not merely cases of shoddy science. The leaked emails made it apparent that it was done purposefully, just as many skeptics had suspected for years. Scientific fraud.

In one of the emails that was apparently leaked to WikiLeaks by a whistleblower the disgraced former head of the University of East Anglia's Climatic Research Unit, Phil Jones said "Why should I make the data available to you, when your aim is to try and find something wrong with it". That is literally what he said to another researcher.

If the findings of a scientific study are non-replicable for any reason(s) whatsoever (in this case the dog ate Wang's homework and Jones did not want to be proven wrong) then those findings should be dismissed and another study should be done.
 
Last edited:
He's referring to the one that came to an end in 1850. All of the warming we have experienced since then is taking us back UP to where we used to be.

It doesn't matter. He and you are still full of crap. Why not tell me more about how the earth used to be a lot hotter a billion years ago.

History and science back us up. Not you. You can call us all the names you wish but the reality is there IS no scientific support for the AGW theory. That is a fact. Your silly name calling isn't.

Like it or not, your "science" is fools science. I have heard it said that if you took an average size globe and put a coat of varnish on it, the thickness of the varnish would be a pretty good approximation of thickness of the earth's atmosphere. And each year, humans are responsible for releasing 26.8 billion tons of CO2 into it. That has to and is having an effect.


Wrong. I suggest you look up the term "pseudo science" And look up the term "non falsifiable". Both of those terms fit AGW "theory" to a T. But that's real science and real science scares you religious nutters.
I believe the term you're probably looking for here is "non-replicable". For instance, some of most often cited pseudoscience papers regarding climatology such as the infamous Michael Mann, Raymond Bradley and Malcolm Hughes papers originally published in 1998 and 1999 that were subsequently published by the Intergovernmental Panel on Climate Change which introduced the now thoroughly debunked hockey shtick chart to the general public that was considered by actual scientists to be non-replicable because the authors very suspiciously refused to release either the data or the computer code that they used to produce their strange and previously unheard of hockey shtick chart.

Another egregious example is a psuedoscientific paper written by Phil Jones and Wei-Chung Wang which was published in 1990 regarding the "urban heat island" effect. This is another one of the most often cited papers in the field of climatology. And it is another paper which lacked data. When pushed on the issue Wang claimed to have lost the data from weather stations in rural eastern China. (The classic dog ate my homework excuse).

After WikiLeaks released the damning climategate emails it became obvious that these were not merely cases of shoddy science. The leaked emails made it apparent that it was done purposefully, just as many skeptics had suspected for years. Scientific fraud.

In one of the emails that was apparently leaked to WikiLeaks by a whistleblower the disgraced former head of the University of East Anglia's Climatic Research Unit, Phil Jones said "Why should I make the data available to you, when your aim is to try and find something wrong with it". That is literally what he said to another researcher.

If the findings of a scientific study are non-replicable for any reason(s) whatsoever (in this case the dog ate Wang's homework and Jones did not want to be proven wrong) then those findings should be dismissed and another study should be done.


Nope. Non falsifiable is the proper term. Any theory that has no test to falsify is by definition a pseudo science.
 
Wow! Are you full of crap! Each year all the volcanoes on earth release about 200 million tons of CO2 into the environment. The activities of humans are responsible for the release of about 26.8 BILLION tons. Like it or not, CO2 IS leading the way.s
You are dodging the question. The question you responded to has nothing to do with volcanoes. It was regarding whether rises in ambient temperature tend to precede rises of the CO2 levels in the ambient air or vice-versa.The fact that you dodged the question strongly indicates that you either have no clue or that you know that you are being deceptive.

How many ways do I need to say that CO2 leads the way.


Really? Water vapor is a more potent greenhouse gas than CO2.
And water vapor gets rained out in under 10 days, whereas CO2 is there for many decades. So the effect is that CO2 warms the atmosphere, which warms the oceans, resulting in more evaporation, which results in more warming.

Yes, water vapor is a more potent GHG than CO2, but it is is dependent on the long term warming of CO2. And the feedback effect is already noticeable in the much larger precipitation events we are now seeing.


Bull poo. RT for CO2 ACCORDING to the overwhelming majority of peer reviewed studies is under 10 years. It is ONLY the ipcc who claims otherwise.

Carbon-dioxide-residence-time.jpg
National Academies of Science

Carbon residence time dominates uncertainty in terrestrial vegetation responses to future climate and atmospheric CO2

Carbon residence time dominates uncertainty in terrestrial vegetation responses to future climate and atmospheric CO2
  1. Andrew D. Frienda,1,
  2. Wolfgang Luchtb,c,
  3. Tim T. Rademachera,
  4. Rozenn Keribina,
  5. Richard Bettsd,
  6. Patricia Cadulee,
  7. Philippe Ciaisf,
  8. Douglas B. Clarkg,
  9. Rutger Dankersd,
  10. Pete D. Falloond,
  11. Akihiko Itoh,
  12. Ron Kahanad,
  13. Axel Kleidoni,
  14. Mark R. Lomasj,
  15. Kazuya Nishinah,
  16. Sebastian Ostbergb,
  17. Ryan Pavlicki,
  18. Philippe Peylinf,
  19. Sibyll Schaphoffb,
  20. Nicolas Vuichardf,
  21. Lila Warszawskib,
  22. Andy Wiltshired, and
  23. F. Ian Woodwardj
Author Affiliations

  1. Edited by Katja Frieler, Potsdam Institute for Climate Impact Research, Potsdam, Germany, and accepted by the Editorial Board August 31, 2013 (received for review January 31, 2013)
  1. Abstract
  2. Full Text
  3. Authors & Info
  4. Figures
  5. SI
  6. Metrics
  7. Related Content
  8. PDF
  9. PDF + SI


Abstract
Future climate change and increasing atmospheric CO2 are expected to cause major changes in vegetation structure and function over large fractions of the global land surface. Seven global vegetation models are used to analyze possible responses to future climate simulated by a range of general circulation models run under all four representative concentration pathway scenarios of changing concentrations of greenhouse gases. All 110 simulations predict an increase in global vegetation carbon to 2100, but with substantial variation between vegetation models. For example, at 4 °C of global land surface warming (510–758 ppm of CO2), vegetation carbon increases by 52–477 Pg C (224 Pg C mean), mainly due to CO2 fertilization of photosynthesis. Simulations agree on large regional increases across much of the boreal forest, western Amazonia, central Africa, western China, and southeast Asia, with reductions across southwestern North America, central South America, southern Mediterranean areas, southwestern Africa, and southwestern Australia. Four vegetation models display discontinuities across 4 °C of warming, indicating global thresholds in the balance of positive and negative influences on productivity and biomass. In contrast to previous global vegetation model studies, we emphasize the importance of uncertainties in projected changes in carbon residence times. We find, when all seven models are considered for one representative concentration pathway × general circulation model combination, such uncertainties explain 30% more variation in modeled vegetation carbon change than responses of net primary productivity alone, increasing to 151% for non-HYBRID4 models. A change in research priorities away from production and toward structural dynamics and demographic processes is recommended.
 
Wow! Are you full of crap! Each year all the volcanoes on earth release about 200 million tons of CO2 into the environment. The activities of humans are responsible for the release of about 26.8 BILLION tons. Like it or not, CO2 IS leading the way.s
You are dodging the question. The question you responded to has nothing to do with volcanoes. It was regarding whether rises in ambient temperature tend to precede rises of the CO2 levels in the ambient air or vice-versa.The fact that you dodged the question strongly indicates that you either have no clue or that you know that you are being deceptive.

How many ways do I need to say that CO2 leads the way.


Really? Water vapor is a more potent greenhouse gas than CO2.
And water vapor gets rained out in under 10 days, whereas CO2 is there for many decades. So the effect is that CO2 warms the atmosphere, which warms the oceans, resulting in more evaporation, which results in more warming.

Yes, water vapor is a more potent GHG than CO2, but it is is dependent on the long term warming of CO2. And the feedback effect is already noticeable in the much larger precipitation events we are now seeing.


Bull poo. RT for CO2 ACCORDING to the overwhelming majority of peer reviewed studies is under 10 years. It is ONLY the ipcc who claims otherwise.

Carbon-dioxide-residence-time.jpg
Target atmospheric CO2: Where should humanity aim?
J. Hansen (1 and 2), M. Sato (1 and 2), P. Kharecha (1 and 2), D. Beerling (3), R. Berner (4), V. Masson-Delmotte (5), M. Pagani (4), M. Raymo (6), D. L. Royer(7), J. C. Zachos (8) ((1) NASA GISS, (2) Columbia Univ. Earth Institute, (3) Univ. Sheffield, (4) Yale Univ., (5) LSCE/IPSL, (6) Boston Univ., (7) Wesleyan Univ., (8) Univ. California Santa Cruz)
(Submitted on 7 Apr 2008 (v1), last revised 15 Oct 2008 (this version, v3))
Paleoclimate data show that climate sensitivity is ~3 deg-C for doubled CO2, including only fast feedback processes. Equilibrium sensitivity, including slower surface albedo feedbacks, is ~6 deg-C for doubled CO2 for the range of climate states between glacial conditions and ice-free Antarctica. Decreasing CO2 was the main cause of a cooling trend that began 50 million years ago, large scale glaciation occurring when CO2 fell to 450 +/- 100 ppm, a level that will be exceeded within decades, barring prompt policy changes. If humanity wishes to preserve a planet similar to that on which civilization developed and to which life on Earth is adapted, paleoclimate evidence and ongoing climate change suggest that CO2 will need to be reduced from its current 385 ppm to at most 350 ppm. The largest uncertainty in the target arises from possible changes of non-CO2 forcings. An initial 350 ppm CO2 target may be achievable by phasing out coal use except where CO2 is captured and adopting agricultural and forestry practices that sequester carbon. If the present overshoot of this target CO2 is not brief, there is a possibility of seeding irreversible catastrophic effects.

[0804.1126] Target atmospheric CO2: Where should humanity aim?

More science
 
Atmospheric carbon dioxide removal: long-term consequences and commitment
Long Cao and Ken Caldeira

Published 30 June 2010 • IOP Publishing Ltd
Environmental Research Letters, Volume 5, Number 2

Article PDF
Figures

References
Citations

PDF
Cited by 21 articles


  • Blogged by 3
    Referenced in 1 Wikipedia pages
    56 readers on Mendeley
    5 readers on CiteULike
    See more details | Close this
    × " data-badge-popover="right" style="margin-right: 0px; margin-left: 0px; padding-right: 0px; padding-left: 0px; border: 0px; font-style: inherit; font-variant: inherit; font-weight: inherit; font-stretch: inherit; font-size: inherit; line-height: inherit; font-family: inherit; vertical-align: baseline; color: rgb(0, 110, 178); display: inline-block;">
  • Share this article
Article information
Abstract
Carbon capture from ambient air has been proposed as a mitigation strategy to counteract anthropogenic climate change. We use an Earth system model to investigate the response of the coupled climate–carbon system to an instantaneous removal of all anthropogenic CO2 from the atmosphere. In our extreme and idealized simulations, anthropogenic CO2 emissions are halted and all anthropogenic CO2 is removed from the atmosphere at year 2050 under the IPCC A2 CO2emission scenario when the model-simulated atmospheric CO2 reaches 511 ppm and surface temperature reaches 1.8 °C above the pre-industrial level. In our simulations a one-time removal of all anthropogenic CO2 in the atmosphere reduces surface air temperature by 0.8 °C within a few years, but 1 °C surface warming above pre-industrial levels lasts for several centuries. In other words, a one-time removal of 100% excess CO2 from the atmosphere offsets less than 50% of the warming experienced at the time of removal. To maintain atmospheric CO2 and temperature at low levels, not only does anthropogenic CO2 in the atmosphere need to be removed, but anthropogenic CO2 stored in the ocean and land needs to be removed as well when it outgasses to the atmosphere. In our simulation to maintain atmospheric CO2 concentrations at pre-industrial levels for centuries, an additional amount of CO2 equal to the original CO2 captured would need to be removed over the subsequent 80 years.

Atmospheric carbon dioxide removal: long-term consequences and commitment - IOPscience

more science
 
Long-term climate changes due to increased CO2concentration in the coupled atmosphere-ocean general circulation model ECHAM3/LSG
  • R. Voss
  • U. Mikolajewicz
  1. 1.
DOI: 10.1007/PL00007925

Cite this article as:
Voss, R. & Mikolajewicz, U. Climate Dynamics (2001) 17: 45. doi:10.1007/PL00007925
Abstract
 The long-term adjustment processes of atmosphere and ocean in response to gradually increased atmospheric CO2 concentration have been analysed in two 850-year integrations with a coupled atmosphere-ocean general circulation model (AOGCM). In these experiments the CO2 concentration has been increased to double and four times the initial concentration, respectively, and is kept fixed thereafter. Three characteristic time scales have been identified: a very fast response associated with processes dominated by the atmospheric adjustment, an intermediate time scale of a few decades connected with processes in the upper ocean, and adjustment processes with time scales of centuries and longer due to the inertia of the deep ocean. The latter in particular is responsible for a still ongoing adjustment of the atmosphere-ocean system at the end of the integrations after 850 years. After 60 years, at the time of CO2doubling, the global mean near-surface air temperature rises by 1.4 K. In spite of the constant CO2 concentration during the following centuries the warming continues to 2.6 K after 850 years. The behaviour of the quadrupling run is similar: global mean near-surface air temperature increases by 3.8 K at the time of CO2 quadrupling and by 4.8 K at the end of the simulation. The thermohaline circulation undergoes remarkable changes. Temporarily, the North Atlantic overturning circulation weakens by up to 30% in the CO2 doubling experiment and up to 50% in the CO2 quadrupling experiment. After reaching the minimum the North Atlantic overturning slowly recovers in both experiments.

Received: 23 August 1999 / Accepted: 27 April 2000

Long-term climate changes due to increased CO2 concentration in the coupled atmosphere-ocean general circulation model ECHAM3/LSG

science
 
It doesn't matter. He and you are still full of crap. Why not tell me more about how the earth used to be a lot hotter a billion years ago.

History and science back us up. Not you. You can call us all the names you wish but the reality is there IS no scientific support for the AGW theory. That is a fact. Your silly name calling isn't.

Like it or not, your "science" is fools science. I have heard it said that if you took an average size globe and put a coat of varnish on it, the thickness of the varnish would be a pretty good approximation of thickness of the earth's atmosphere. And each year, humans are responsible for releasing 26.8 billion tons of CO2 into it. That has to and is having an effect.


Wrong. I suggest you look up the term "pseudo science" And look up the term "non falsifiable". Both of those terms fit AGW "theory" to a T. But that's real science and real science scares you religious nutters.
I believe the term you're probably looking for here is "non-replicable". For instance, some of most often cited pseudoscience papers regarding climatology such as the infamous Michael Mann, Raymond Bradley and Malcolm Hughes papers originally published in 1998 and 1999 that were subsequently published by the Intergovernmental Panel on Climate Change which introduced the now thoroughly debunked hockey shtick chart to the general public that was considered by actual scientists to be non-replicable because the authors very suspiciously refused to release either the data or the computer code that they used to produce their strange and previously unheard of hockey shtick chart.

Another egregious example is a psuedoscientific paper written by Phil Jones and Wei-Chung Wang which was published in 1990 regarding the "urban heat island" effect. This is another one of the most often cited papers in the field of climatology. And it is another paper which lacked data. When pushed on the issue Wang claimed to have lost the data from weather stations in rural eastern China. (The classic dog ate my homework excuse).

After WikiLeaks released the damning climategate emails it became obvious that these were not merely cases of shoddy science. The leaked emails made it apparent that it was done purposefully, just as many skeptics had suspected for years. Scientific fraud.

In one of the emails that was apparently leaked to WikiLeaks by a whistleblower the disgraced former head of the University of East Anglia's Climatic Research Unit, Phil Jones said "Why should I make the data available to you, when your aim is to try and find something wrong with it". That is literally what he said to another researcher.

If the findings of a scientific study are non-replicable for any reason(s) whatsoever (in this case the dog ate Wang's homework and Jones did not want to be proven wrong) then those findings should be dismissed and another study should be done.


Nope. Non falsifiable is the proper term. Any theory that has no test to falsify is by definition a pseudo science.
Now if the Arctic Ice, and alpine glaciers were increasing in mass, while the CO2 in the atmosphere increased, that would falsify the AGW. However, what we are seeing is exactly what AGW predicts. Pseudo science is your specialty.
 
How many ways do I need to say that CO2 leads the way.
Are you trying to become the King of Dumb Questions?

Okay, I will answer, the answer is ONE, you only need to say it once, as scientific fact. So go ahead, now is your chance.

It is scientific FACT that CO2 in the atmosphere increases global warming. If you are trying to tell me that the earth somehow is warming when it is supposed to be heading toward another ice age and that causes CO2 to increase, you are barking up the wrong tree. Also, feel like going for a COLD swim? Come to my home town and try to go ice fishing. It is a scientific fact that you will get wet.


Nope. It's a scientific theory. One that has no laboratory, nor empirical data to support. It is a theory wholly based on computer models and falsified data with a healthy dose of correlation tossed in for good measure.
em·pir·i·cal
əmˈpirik(ə)l/
adjective
  1. based on, concerned with, or verifiable by observation or experience rather than theory or pure logic.
    "they provided considerable empirical evidence to support their argument"
    synonyms: experiential, practical, heuristic, firsthand, hands-on;
    observed, evidence-based, seen, demonstrable
    "many of these predictions have received empirical confirmation"
N_stddev_timeseries_thumb.png


S_stddev_timeseries_thumb.png

Arctic Sea Ice News and Analysis | Sea ice data updated daily with one-day lag


UAH_LT_1979_thru_December_2016_v6-550x318.jpg


Latest Global Temps « Roy Spencer, PhD

AUGUST 20, 2015

Disastrous Year for North Cascade Glacier Mass Balance (Snow/Ice Economy)
Posted by Mauri Pelto

38


Mass loss of North Cascade glaciers visualized.

A disastrous year is unfolding in 2015 for North Cascade glaciers, if normal melt conditions continue the range will lose 5-7% of its entire glacier volume in one year! For the 32nd consecutive year we were in the North Cascade Range, of Washington to observe the mass balance of glaciers across the entire mountain range. The melt season is not over, but already the mass loss is greater than any other year, with six weeks of melting left. An alpine glacier’s income is the snow that accumulates, and to be have an equilibrium balance sheet for a year, alpine glaciers typically need 50-65% snowcovered surfaces at the end of the melt season. Below the accumulation zone, net assets are lost via ablation.

In 2015 of the 9 glaciers we examined in detail, 6 had less than 2% retained snowcover, which will be gone by the end of August. Two more had no 2015 snowpack greater than 1.7 m in depth, which will also melt away before summer ends. Average ablation during the August field season was 7 cm per day of snow, and 7.5 cm of ice. Only one glacier will have any retained snowcover at the end of the summer, we will be checking just how much in late September. This is the equivalent of a business having no net income for a year, but continuing to have to pay all of its bills. Of course that comes on top of more than 27 years of consecutive mass balance loss for the entire “industry” of global alpine glaciers. The business model of alpine glaciers is not working and until the climate they run their “businesses” in changes, alpine glaciers have an unsustainable business model. Below this is illustrated glacier by glacier from this summer. A following post will look at the glacier runoff aspect of this years field season. The Seattle Times also featured our summer research.
ba2014.jpg


Disastrous Year for North Cascade Glacier Mass Balance (Snow/Ice Economy) - From a Glacier's Perspective

Empirical evidence that AGW is correct, and Mr. Westwall is full of shit.
 
Man makes the climate change. Interesting.
How did our 200K year old species do it 3 billion years ago?

Man made global warming started to show up at the beginning of the industrial revolution. Coincidence?

We were exiting the Little Ice Age at the start of the industrial revolution.. SO your claiming that all of the warming is man made when it is easily shown to be natural variation?

The only "coincidence" is the fact we have just left an active solar phase (which created the increased heat) and our warming is coming to an end..

What little ice age are you talking about. There have been at least a few in historical times. And for those that did happen, could something like the eruption of Krakatoa have anything to do with it?


He's referring to the one that came to an end in 1850. All of the warming we have experienced since then is taking us back UP to where we used to be.
Fucked up bullshit and a lie, as you know well.

200 Years Worth of Temperature Data Compiled in One Alarming Video


Stephen Messenger (@smessenger)
Science / Climate Change
November 10, 2011

Share on Facebook

surface-temp-map-stil.jpg


200 Years Worth of Temperature Data Compiled in One Alarming Video
 
How many ways do I need to say that CO2 leads the way.
Are you trying to become the King of Dumb Questions?

Okay, I will answer, the answer is ONE, you only need to say it once, as scientific fact. So go ahead, now is your chance.

It is scientific FACT that CO2 in the atmosphere increases global warming. If you are trying to tell me that the earth somehow is warming when it is supposed to be heading toward another ice age and that causes CO2 to increase, you are barking up the wrong tree. Also, feel like going for a COLD swim? Come to my home town and try to go ice fishing. It is a scientific fact that you will get wet.


Nope. It's a scientific theory. One that has no laboratory, nor empirical data to support. It is a theory wholly based on computer models and falsified data with a healthy dose of correlation tossed in for good measure.

People have been measuring both temperatures and CO2 for decades. CO2 has been leading the way.


Actually it hasn't. CO2 has continued to increase while the global temps haven't budged in 18+years. The continued claims of "last year was the warmest ever" are all fiction.
Once again, you repeat a lie without conscience.
GLOBAL LAND-OCEAN TEMPERATURE INDEX
Data source: NASA's Goddard Institute for Space Studies (GISS). Credit: NASA/GISS

Climate Change: Vital Signs of the Planet: Global Temperature
 

Attachments

  • upload_2017-1-25_19-53-53.png
    upload_2017-1-25_19-53-53.png
    127 bytes · Views: 17
  • upload_2017-1-25_19-54-23.png
    upload_2017-1-25_19-54-23.png
    127 bytes · Views: 12
How many ways do I need to say that CO2 leads the way.
Are you trying to become the King of Dumb Questions?

Okay, I will answer, the answer is ONE, you only need to say it once, as scientific fact. So go ahead, now is your chance.

It is scientific FACT that CO2 in the atmosphere increases global warming. If you are trying to tell me that the earth somehow is warming when it is supposed to be heading toward another ice age and that causes CO2 to increase, you are barking up the wrong tree. Also, feel like going for a COLD swim? Come to my home town and try to go ice fishing. It is a scientific fact that you will get wet.


Nope. It's a scientific theory. One that has no laboratory, nor empirical data to support. It is a theory wholly based on computer models and falsified data with a healthy dose of correlation tossed in for good measure.
em·pir·i·cal
əmˈpirik(ə)l/
adjective
  1. based on, concerned with, or verifiable by observation or experience rather than theory or pure logic.
    "they provided considerable empirical evidence to support their argument"
    synonyms: experiential, practical, heuristic, firsthand, hands-on;
    observed, evidence-based, seen, demonstrable
    "many of these predictions have received empirical confirmation"
N_stddev_timeseries_thumb.png


S_stddev_timeseries_thumb.png

Arctic Sea Ice News and Analysis | Sea ice data updated daily with one-day lag


UAH_LT_1979_thru_December_2016_v6-550x318.jpg


Latest Global Temps « Roy Spencer, PhD

AUGUST 20, 2015

Disastrous Year for North Cascade Glacier Mass Balance (Snow/Ice Economy)
Posted by Mauri Pelto

38


Mass loss of North Cascade glaciers visualized.

A disastrous year is unfolding in 2015 for North Cascade glaciers, if normal melt conditions continue the range will lose 5-7% of its entire glacier volume in one year! For the 32nd consecutive year we were in the North Cascade Range, of Washington to observe the mass balance of glaciers across the entire mountain range. The melt season is not over, but already the mass loss is greater than any other year, with six weeks of melting left. An alpine glacier’s income is the snow that accumulates, and to be have an equilibrium balance sheet for a year, alpine glaciers typically need 50-65% snowcovered surfaces at the end of the melt season. Below the accumulation zone, net assets are lost via ablation.

In 2015 of the 9 glaciers we examined in detail, 6 had less than 2% retained snowcover, which will be gone by the end of August. Two more had no 2015 snowpack greater than 1.7 m in depth, which will also melt away before summer ends. Average ablation during the August field season was 7 cm per day of snow, and 7.5 cm of ice. Only one glacier will have any retained snowcover at the end of the summer, we will be checking just how much in late September. This is the equivalent of a business having no net income for a year, but continuing to have to pay all of its bills. Of course that comes on top of more than 27 years of consecutive mass balance loss for the entire “industry” of global alpine glaciers. The business model of alpine glaciers is not working and until the climate they run their “businesses” in changes, alpine glaciers have an unsustainable business model. Below this is illustrated glacier by glacier from this summer. A following post will look at the glacier runoff aspect of this years field season. The Seattle Times also featured our summer research.
ba2014.jpg


Disastrous Year for North Cascade Glacier Mass Balance (Snow/Ice Economy) - From a Glacier's Perspective

Empirical evidence that AGW is correct, and Mr. Westwall is full of shit.


CORRELATION DOES NOT EQUAL CAUSATION
, DUMBASS!
 
Dumbass yourself, you old fraud. You bunch predicted no warming or effects from the increasing GHGs in the atmosphere. Now we are seeing the Arctic Ice going away, empirical, observed evidence, that it GHGs do warm the atmosphere. And you just keep repeating your nonsense idiocy.
 

Forum List

Back
Top