Old Rocks
Diamond Member
We are in a La Nina, and yet above the 2000 to 2010 average.

Follow along with the video below to see how to install our site as a web app on your home screen.
Note: This feature may not be available in some browsers.


I don't see a link to Crusader Frank's data here. I thought that was a requirement.
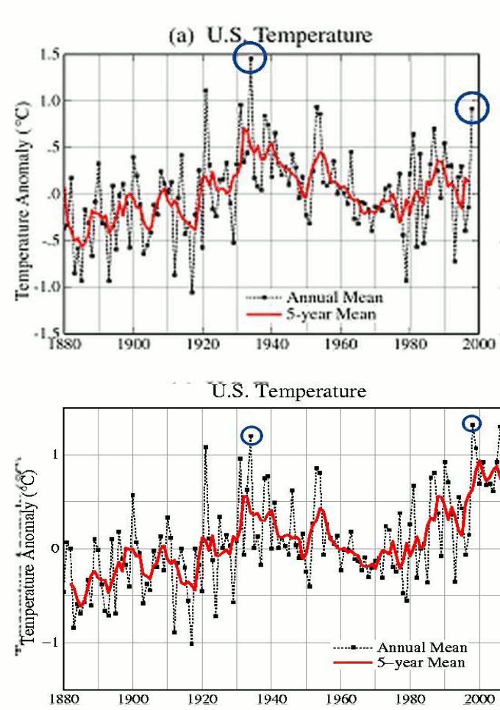
When the data refuses to agree with the AGW Foregone Conclusion, we adjust the data because it is clearly a DENIER!
Where do you see a cooling trend?
View attachment 595752View attachment 595753
View attachment 595755

You've never seen that before?I don't see a link to Crusader Frank's data here. I thought that was a requirement.
The data I posted covers the last 6-7 years and shows no cooling trend. And you provided no link to the source of your data. Have you remedied that shortcoming?
Where is your evidence that what I posted is wrong?
I am talking about a CURRENT Cooling trend; you post a chart going back to 1850 that doesn't address what I posted which covers the last 6-7 years never disputed the warming since the mid 1800's.
You can't be that clueless here.
What is the imaginary average temperature of Earth from which you compute this imaginary "anomoly" of .5 or whatever?
Where is your evidence that what I posted is wrong?
I am talking about a CURRENT Cooling trend; you post a chart going back to 1850 that doesn't address what I posted which covers the last 6-7 years never disputed the warming since the mid 1800's.
You can't be that clueless here.
Is this a difficult question?The data I presented is quite clear. You are simply trying to avoid answering the question. WHERE did your data come from?
The data I posted covers the last 6-7 years and shows no cooling trend. And you provided no link to the source of your data. Have you remedied that shortcoming?


