excalibur
Diamond Member
- Mar 19, 2015
- 19,616
- 37,668
The vaccines are a disaster and thus a "booster" within months of two shots.

 alexberenson.substack.com
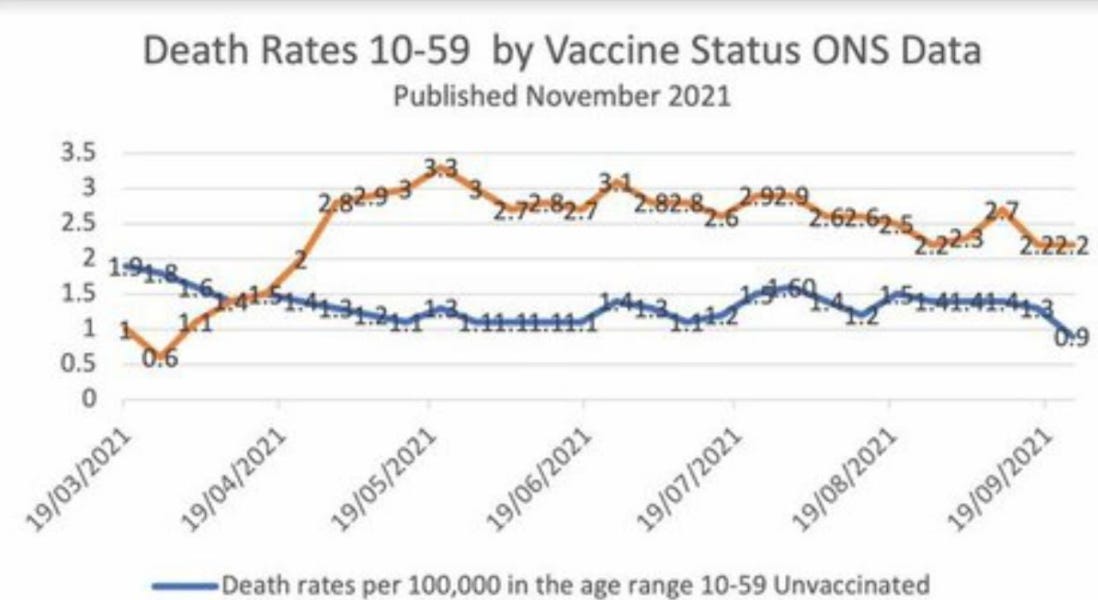
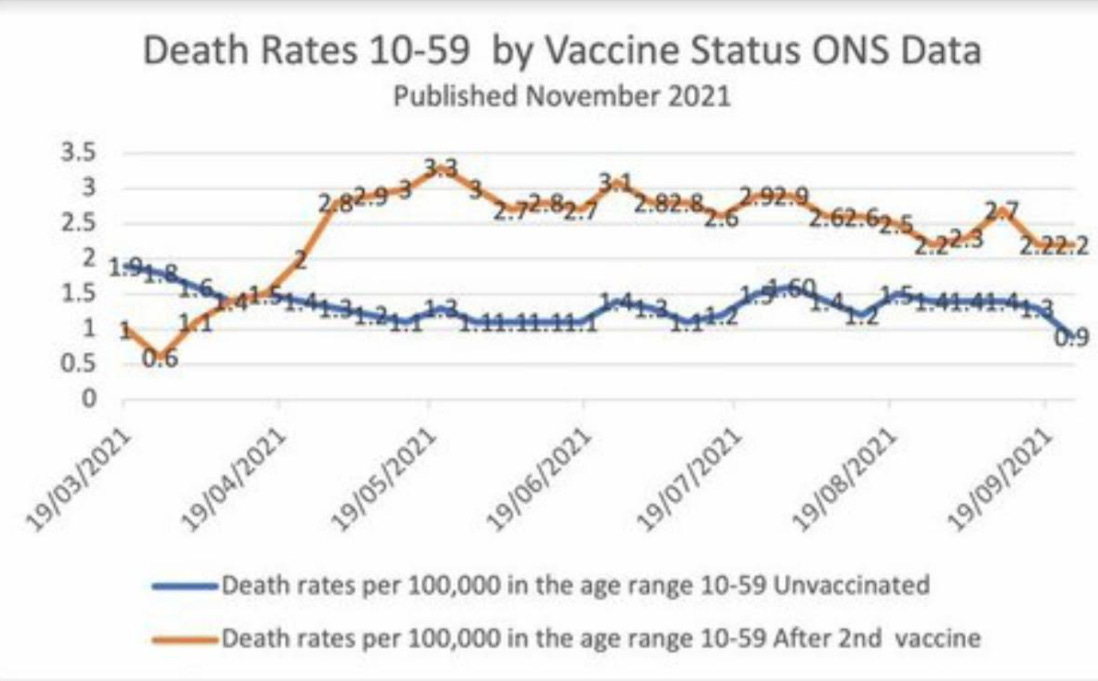
And have been for six months. This chart may seem unbelievable or impossible, but it's correct, based on weekly data from the British government.
The brown line represents weekly deaths from all causes of vaccinated people aged 10-59, per 100,000 people.
The blue line represents weekly deaths from all causes of unvaccinated people per 100,000 in the same age range.

I have checked the underlying dataset myself and this graph is correct. Vaccinated people under 60 are twice as likely to die as unvaccinated people. And overall deaths in Britain are running well above normal.
I don’t know how to explain this other than vaccine-caused mortality.
The basic data is available here, download the Excel file and see table 4:
Deaths by vaccination status, England - Office for National Statistics
Age-standardised mortality rates for deaths involving coronavirus (COVID-19), non-COVID-19 deaths and all deaths by vaccination status, broken down by age group.
www.ons.gov.uk
Vaccinated English adults under 60 are dying at twice the rate of unvaccinated people the same age
And have been for six months. This chart may seem unbelievable or impossible, but it's correct, based on weekly data from the British government.
alexberenson.substack.com