Navigation
Install the app
How to install the app on iOS
Follow along with the video below to see how to install our site as a web app on your home screen.
Note: This feature may not be available in some browsers.
More options
You are using an out of date browser. It may not display this or other websites correctly.
You should upgrade or use an alternative browser.
You should upgrade or use an alternative browser.
Arctic Sea Ice ^UP^ By 60%. Global Warming?
- Thread starter DriftingSand
- Start date


the satellite record started at a high point in ice extent. sure there has been a decrease in minimum extents, and a smaller decrease in maximum extents, but overall the ice is pulsing in a very average and normal way.
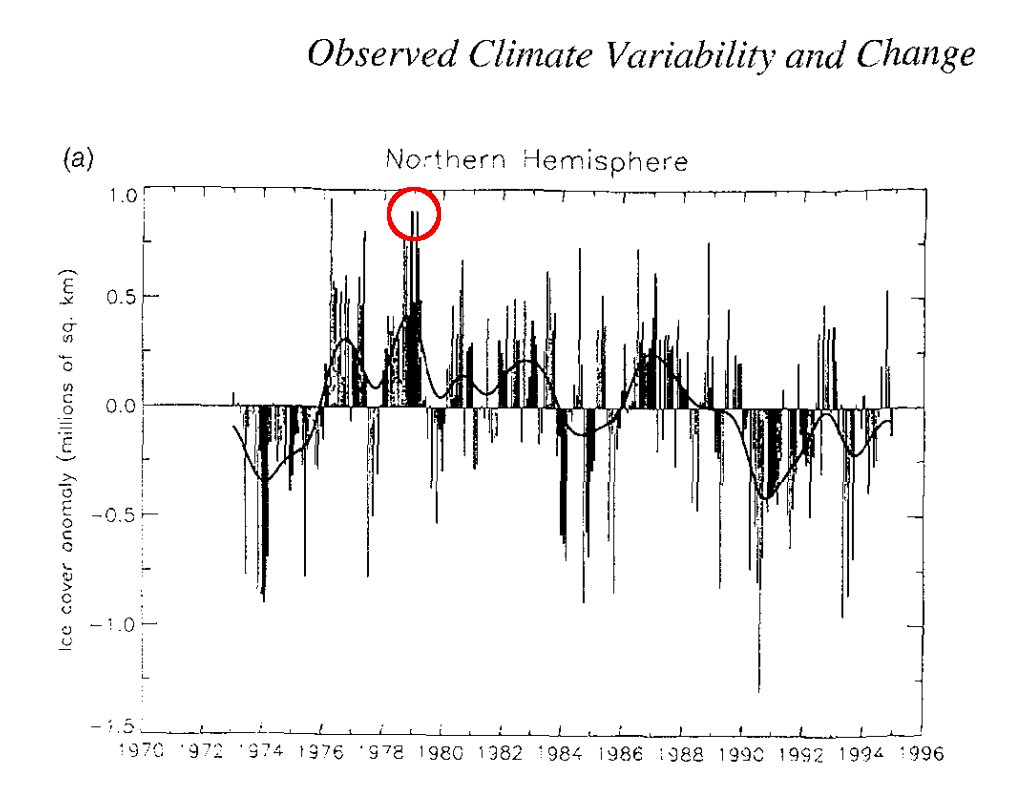
here is an IPCC chart to put 1979 into perspective-
the satellite record started at a high point in ice extent. sure there has been a decrease in minimum extents, and a smaller decrease in maximum extents, but overall the ice is pulsing in a very average and normal way.
Pulsing? Pulsing? That data clearly show the ice extents have been declining. And what studies back up your claim that extents were particularly high in 1979?
here is an IPCC chart to put 1979 into perspective-
Before you label that piece of nonsense IPCC data, I think you ought to identify an IPCC address where it may be found. It starts before satelllite data and and ends in 1995, when it was produced. Is there any particular reason you and the admirable Mr Goddard (Electrical Engineer extraodinaire) should present such dated data? Hmm....
new here? welcome.
pulsing? yah, I see it as pulsing. arctic ice from 1979-2009-
[ame=http://www.youtube.com/watch?v=6j8SGs_gnFk]Arctic Sea Ice timelapse from 1978 to 2009 - YouTube[/ame]
do you have a link to the first IPCC report with the graphs? I would much rather link to that than Goddard's site. but until I have a better way of posting it.....
or perhaps you think it is a fraud????? I am certain that it is an genuine IPCC graph. of course back then there wasnt the same pressure to massage the data to give a favoured result. hahahaha, perhaps you are only complaining that the 'reanalyzed' data looks different!
mamooth
Diamond Member
of course back then there wasnt the same pressure to massage the data to give a favoured result.
True, denialism and the data fudging which kind of defines it is a sort of new and ugly thing.
Now, decent sea ice records go back to 1953 from ice charts. That data definitely shows crashing, not pulsing. Is there some reason you use data which is older, less accurate and harder to read, other than to massage the data in order to give a favoured result?
That can't be right. That other thread says Arctic ice extents are up 60%. I don't see it. There must be something wrong with your data. ;-(
RollingThunder
Gold Member
- Mar 22, 2010
- 4,818
- 525
- 155
sure there has been a decrease in minimum extents, and a smaller decrease in maximum extents, but overall the ice is pulsing in a very average and normal way.
You are such a kook! Here's what has actually been happening with the ice in the Arctic. If this doesn't work on here, go to youtube and enter this: http://m.youtube.com/watch?v=YgiMBxaL19M&autoplay=1
[Youtube]http://m.youtube.com/watch?v=YgiMBxaL19M&autoplay=1[/youtube]
Last edited:
the satellite record started at a high point in ice extent. sure there has been a decrease in minimum extents, and a smaller decrease in maximum extents, but overall the ice is pulsing in a very average and normal way.
Pulsing? Pulsing? That data clearly show the ice extents have been declining. And what studies back up your claim that extents were particularly high in 1979?
here is an IPCC chart to put 1979 into perspective-
Before you label that piece of nonsense IPCC data, I think you ought to identify an IPCC address where it may be found. It starts before satelllite data and and ends in 1995, when it was produced. Is there any particular reason you and the admirable Mr Goddard (Electrical Engineer extraodinaire) should present such dated data? Hmm....
new here? welcome.
pulsing? yah, I see it as pulsing. arctic ice from 1979-2009-
[ame=http://www.youtube.com/watch?v=6j8SGs_gnFk]Arctic Sea Ice timelapse from 1978 to 2009 - YouTube[/ame]
do you have a link to the first IPCC report with the graphs? I would much rather link to that than Goddard's site. but until I have a better way of posting it.....
or perhaps you think it is a fraud????? I am certain that it is an genuine IPCC graph. of course back then there wasnt the same pressure to massage the data to give a favoured result. hahahaha, perhaps you are only complaining that the 'reanalyzed' data looks different!
You presented the graph. You claimed it was IPCC data. It's your responsibility to find the proof that statement is true.
The only pulsing I see is one remarkably close to one year in period. Other than that, all I see is a steady decline with some of the expected noise. ARE YOU SUGGESTING THERE HAS BEEN NO DECLINE IN ARCTIC ICE EXTENTS IN THE MODERN RECORD?
I continue to claim it is IPCC data. you can be sure it would have been contested if it was not. Goddard has more enemies than just about any other skeptic blogger.
of course I am not suggesting there has been no decline in Arctic ice extent. my graphs even give the trends for the maxima and minima. my point is that there is no imminent disappearance of Arctic ice in the near future. the majority of Arctic glacial and sea ice that disappeared, did so before 1900. it will continue to melt as long as we are in a warm era until it comes to an equilibrium.
the 20's also had a large shrinkage of Arctic Ice. when I investigated the temperature and ice 'historical records' I found little evidence to support the written descriptions of the time. since then I have been wary of putting too much stock in 'reanalyzed' data, eg Trenberth's ocean heat content history that simply doesnt look like the data as it was recorded.
skookerasbil
Platinum Member
Ian....go check out the DRUDGE REPORT right now.......
Here is the headline >>>
GLOBAL WARMING SCIENTISTS COVERED UP SCEPTIC'S 'DAMAGING' REVIEW
I laughed so hard, I spit my coffee onto the screen of my 'puter.
Here is the headline >>>
GLOBAL WARMING SCIENTISTS COVERED UP SCEPTIC'S 'DAMAGING' REVIEW
I laughed so hard, I spit my coffee onto the screen of my 'puter.
Ian....go check out the DRUDGE REPORT right now.......
Here is the headline >>>
GLOBAL WARMING SCIENTISTS COVERED UP SCEPTIC'S 'DAMAGING' REVIEW
I laughed so hard, I spit my coffee onto the screen of my 'puter.
those paywalls piss me off. I wish LB would just produce some of the intimidating emails with the names redacted.

doesnt look like a death spiral now, huh?
btw the original is on p224 IPCC FAR WG1 found herehttp://www.ipcc.ch/ipccreports/far/wg_I/ipcc_far_wg_I_full_report.pdf
If you agree it is declining, on what do you base your rejection of the idea that it will go to zero? What factors in equilibrium would stop the decline? Ever since 1979 and some period before, more ice melts in the summer than freezes in the winter. The temperature of the atmosphere and the oceans has continued to rise and - with continuing increases in GHG levels - will continue to do so. The loss of ice reduces the local albedo and thus increases warming. What is it that you think will achieve equilibrium before we have an ice-free Arctic summer?
If you agree it is declining, on what do you base your rejection of the idea that it will go to zero? What factors in equilibrium would stop the decline? Ever since 1979 and some period before, more ice melts in the summer than freezes in the winter. The temperature of the atmosphere and the oceans has continued to rise and - with continuing increases in GHG levels - will continue to do so. The loss of ice reduces the local albedo and thus increases warming. What is it that you think will achieve equilibrium before we have an ice-free Arctic summer?
I don't know. But since you are concerned and China is becoming the greatest greenhouse gas emitter, will you support my bombing of all Chinese coal powerplants and sending them back to the stoneage?
doesnt look like a death spiral now, huh?
btw the original is on p224 IPCC FAR WG1 found herehttp://www.ipcc.ch/ipccreports/far/wg_I/ipcc_far_wg_I_full_report.pdf
Are you suggesting these are the same data you got from Goddard?
ScienceRocks
Democrat all the way!
- Banned
- #97
doesnt look like a death spiral now, huh?
btw the original is on p224 IPCC FAR WG1 found herehttp://www.ipcc.ch/ipccreports/far/wg_I/ipcc_far_wg_I_full_report.pdf
It isn't a death spiral but more of a "move" of equilibrium of the environment. Since we're in a pause...I wouldn't expect too much more melting.
Kosh
Quick Look Over There!
Anyone claiming to be for science and advocating AGW is cult member and not to be taken seriously on matter of real science vs the religious dogma of AGW.
doesnt look like a death spiral now, huh?
btw the original is on p224 IPCC FAR WG1 found herehttp://www.ipcc.ch/ipccreports/far/wg_I/ipcc_far_wg_I_full_report.pdf
Are you suggesting these are the same data you got from Goddard?
my apologies for not checking the link. I should have noticed that a graph that ends in 1995 couldnt have been in a 1990 publication. I download and inspected http://www.ipcc.ch/ipccreports/sar/wg_I/ipcc_sar_wg_I_full_report.pdf and found figure 3.8 on page 150 of the report. again, my apologies if I sent you on a wild goose chase.
If you agree it is declining, on what do you base your rejection of the idea that it will go to zero? What factors in equilibrium would stop the decline? Ever since 1979 and some period before, more ice melts in the summer than freezes in the winter. The temperature of the atmosphere and the oceans has continued to rise and - with continuing increases in GHG levels - will continue to do so. The loss of ice reduces the local albedo and thus increases warming. What is it that you think will achieve equilibrium before we have an ice-free Arctic summer?
ice extent may occasionally be ice free in September in the future, like it probably was during the Medieval Warm period. I think the albedo effect is highly overstated because the Sun is at such a shallow angle by the time the ice melts, and it is counteracted by open water being able to radiate away heat longer before it becomes insulated with ice again. are you concerned about the much stronger albedo effect at the south pole?
Similar threads
- Replies
- 1
- Views
- 131
- Replies
- 115
- Views
- 3K
- Replies
- 27
- Views
- 697
- Replies
- 61
- Views
- 1K
Latest Discussions
- Replies
- 140
- Views
- 583
- Replies
- 44
- Views
- 245
- Replies
- 21
- Views
- 100
- Replies
- 40
- Views
- 133
- Replies
- 113
- Views
- 481
Forum List
-
-
-
-
-
Political Satire 8537
-
-
-
-
-
-
-
-
-
-
-
-
-
-
-
-
-
-
-
ObamaCare 781
-
-
-
-
-
-
-
-
-
-
-
Member Usernotes 485
-
-
-
-
-
-
-
-
-
-