🌟 Exclusive 2024 Prime Day Deals! 🌟

Unlock unbeatable offers today. Shop here: https://amzn.to/4cEkqYs 🎁

Climate Change Brings Warmer Global Temps

!​

JoinedMar 3, 2006Messages5,450Reaction score1,770Points315
ding said:
CO2 doesn't drive climate change. CO2 has never driven climate change. Solar variability and orbital forcings coupled with albedo of the northern hemisphere have driven all climate fluctuations and environmental uncertainty over the last 3 million years because the planet is uniquely configured for bipolar glaciation and the planet's temperature is at the threshhold for extensive northern hemisphere glaciation.
NOAA
Mid-Holocene Warm Period – About 6,000 Years Ago


""Mid-Holocene Warm Period – About 6,000 Years Ago Paleoclimatologists have long suspected that the "middle Holocene," a period roughly from 7,000 to 5,000 years ago, was warmer than the present day. Terms like the Altithermal or Hypsithermal or Climatic Optimum have all been used to refer to this warm period that marked the middle of the current interglacial period.
Today, however, we know that these terms are obsolete and that the truth of the Holocene is more complicated than originally believed. What is most remarkable about the mid-Holocene is that we now have a good understanding of both the global patterns of temperature change during that period and what caused them.

It appears clear that changes in Earth's orbit have operated slowly over thousands and millions of years to change the amount of solar radiation reaching each latitudinal band of Earth during each month. These Orbital changes can be easily calculated and predict that the Northern Hemisphere Should have been warmer than today during the mid-Holocene in the summer and colder in the winter. The combination of warmer summers and colder winters is apparent for some regions in the proxy records and model simulations. There are some important exceptions to this pattern, however, including colder summers in the monsoon regions of Africa and Asia due to stronger monsoons with associated increased cloud cover during the mid-Holocene, and warmer winters at high latitudes due to reduction of winter sea ice cover caused by more summer melting.

In summary, the mid-Holocene, roughly 6,000 years ago, was generally warmer than today during summer in the Northern Hemisphere.
In some locations, this could be true for winter as well.
Moreover, we clearly know the cause of this Natural warming, and we know without doubt that this proven "astronomical" climate forcing mechanism CANNOT be responsible for the warming over the last 100 years.


https://www.ncei.noaa.gov/sites/default/files/2021-11/12 Mid-Holocene Warm Period & Penultimate Interglacial Period & Early Eocene Period -FINAL OCT 2021.pdf

`
YAWN repeats from TROLLs Ding and SunsetTommy who know they're wrong.
I've Already shredded MANY Times previous.


`
 

!​

JoinedMar 3, 2006Messages5,450Reaction score1,770Points315

NOAA
Mid-Holocene Warm Period – About 6,000 Years Ago


""Mid-Holocene Warm Period – About 6,000 Years Ago Paleoclimatologists have long suspected that the "middle Holocene," a period roughly from 7,000 to 5,000 years ago, was warmer than the present day. Terms like the Altithermal or Hypsithermal or Climatic Optimum have all been used to refer to this warm period that marked the middle of the current interglacial period.
Today, however, we know that these terms are obsolete and that the truth of the Holocene is more complicated than originally believed. What is most remarkable about the mid-Holocene is that we now have a good understanding of both the global patterns of temperature change during that period and what caused them.

It appears clear that changes in Earth's orbit have operated slowly over thousands and millions of years to change the amount of solar radiation reaching each latitudinal band of Earth during each month. These Orbital changes can be easily calculated and predict that the Northern Hemisphere Should have been warmer than today during the mid-Holocene in the summer and colder in the winter. The combination of warmer summers and colder winters is apparent for some regions in the proxy records and model simulations. There are some important exceptions to this pattern, however, including colder summers in the monsoon regions of Africa and Asia due to stronger monsoons with associated increased cloud cover during the mid-Holocene, and warmer winters at high latitudes due to reduction of winter sea ice cover caused by more summer melting.

In summary, the mid-Holocene, roughly 6,000 years ago, was generally warmer than today during summer in the Northern Hemisphere.
In some locations, this could be true for winter as well.
Moreover, we clearly know the cause of this Natural warming, and we know without doubt that this proven "astronomical" climate forcing mechanism CANNOT be responsible for the warming over the last 100 years.


https://www.ncei.noaa.gov/sites/default/files/2021-11/12 Mid-Holocene Warm Period & Penultimate Interglacial Period & Early Eocene Period -FINAL OCT 2021.pdf

`
YAWN repeast from TROLL Fiung who knows he's wrong.
Ju
Exactly... most of the last 10,00 years has been warmer than today with 120 ppm less CO2.
 
Exactly... most of the last 10,00 years has been warmer than today with 120 ppm less CO2.

LOL, Little Last-wording Liar/Repeat troll.

What’s the hottest Earth has been “lately”?​

PUBLISHED SEPTEMBER 17, 2014 - IOW and you have to add 7 MORE years to the vertical Line Up
NOAA

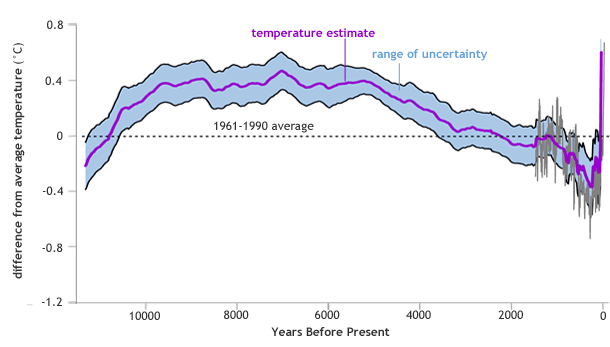
"....The 11,000-year temperature reconstruction shows global average temperature increasing after the end of the last ice age and leveling off about 7550 and 3550 BC. After that time, global temperatures dropped until the "Little Ice Age," bottoming out somewhere between AD 1450 and 1850. Afterwards temperatures rose again, first slowly then very rapidly. (The estimated temperatures for the past 1,500 years correlated with previous research that covered the same time period.)


Graph of temperature history over past 11,000 years

Global temperature anomalies over the past 11,300 years compared to historic average (1961-1990). The purple line shows the annual anomaly, and the light blue band shows the statistical uncertainty (one standard deviation). The gray line shows temperature from a separate analysis spanning the past 1,500 years. Image adapted from Figure 1(b) in Marcott et al.
Natural variability can explain much of the temperature variation since the end of the last ice age, resulting from factors such as changes in the tilt of the Earth's axis.

Over the past century, though, global average temperatures have "risen from near the coldest to the warmest levels" in the past 11,300 years, the 2013 study authors explain. Over this same period, emissions of heat-trapping gases from human activities have increased."

Given the uncertainty inherent in estimating ancient temperatures, the scientists conservatively concluded that the last decade has brought global average temperatures higher than they have been for at least 75% of the last 11,300 years.

The Recent Increase in global average temperature is so Abrupt compared to the rest of the time period that when the scientists make a graph of the data, the end of the line is nearly Vertical.".."


`
 
Last edited:
Exactly... most of the last 10,00 years has been warmer than today with 120 ppm less CO2.

They always ignore this 100% Ice core based data chart, the chart can be clicked twice for large size viewing.

1650478311704.png


LINK

======

See the large temperature swings over the 10,000 years?

See the obvious cooling trend since around 3,200 BC?
 
LOL Little Last-wording Liar/troll.

What’s the hottest Earth has been “lately”?​

PUBLISHED SEPTEMBER 17, 2014
NOAA

"....The 11,000-year temperature reconstruction shows global average temperature increasing after the end of the last ice age and leveling off about 7550 and 3550 BC. After that time, global temperatures dropped until the "Little Ice Age," bottoming out somewhere between AD 1450 and 1850. Afterwards temperatures rose again, first slowly then very rapidly. (The estimated temperatures for the past 1,500 years correlated with previous research that covered the same time period.)


Graph of temperature history over past 11,000 years

Global temperature anomalies over the past 11,300 years compared to historic average (1961-1990). The purple line shows the annual anomaly, and the light blue band shows the statistical uncertainty (one standard deviation). The gray line shows temperature from a separate analysis spanning the past 1,500 years. Image adapted from Figure 1(b) in Marcott et al.
Natural variability can explain much of the temperature variation since the end of the last ice age, resulting from factors such as changes in the tilt of the Earth's axis.

Over the past century, though, global average temperatures have "risen from near the coldest to the warmest levels" in the past 11,300 years, the 2013 study authors explain. Over this same period, emissions of heat-trapping gases from human activities have increased.".."


`
Looks like it was warmer to me.
 
Looks like it was warmer to me.

He is using the long-discredited Chart because Marcott himself states the uptick is no good.

I posted his words many times and Abuthole Afreak who has seen it many times ignores it because he wants to continue to lie and maintain the stupid propaganda behind it.

Marcott states,

"20th century portion of our paleotemperature stack is not statistically robust, cannot be considered representative of global temperature changes, and therefore is not the basis of any of our conclusions."

LINK

===

Worth reading as it exposes the paper problems vividly:

Climate Audit

The Marcott Filibuster


See what a turd Abu is he disagree with Marcott himself .....

Bwahahahahahahahahahahahahahaha!!!
 
Last edited:
This time last year we were in the high 80s today we are looking at 73 degrees. If the Earth is warming up year after year, how can there be a 15 point difference? A progressive slave just doesnt understand "LOGIC".
 
Dummy says wut?

That rural stations have been warming faster than urban stations, demolishing the denier cult "It's the UHI effect!' propaganda.

It's not complicated. Just how many lead paint chips did you eat as a child?

Your graphic didn't challenge that fact. You'd look less stupid if you'd occasionally look at your own memes.

Just where did you get that graphic? A reverse image search on it came up with nothing, so it must be from a very obscure source.
 
A quick summary of all your raving there:

I pointed out your only contribution here, other than butthurt namecalling, was to squeal "look at post 13!'.

In response, you pasted many examples you you screaming insults namecalling and not adding anything to the discussion, other than saying "look at post 13!".

I'll be in touch when I want to you prove any more of my points so conclusively.

It is clear we are dealing with another dog eared drooling warmist/alarmist GOOK
See? Nothing but insults.

Now, back to doing what you hate the most -- ignoring your insults and talking about the science.

Why are you pretending that a graph of one spot in Greenland represents global climate?

Why are you using a chart that stopped showing new data 35 years ago?

Why are you still clinging to your "if climate changed naturally before, it proves humans can't change climate" idiot logic?

You can run again now. Don't worry, nobody expects better of you, so you won't be disappointing anyone.
 
That rural stations have been warming faster than urban stations, demolishing the denier cult "It's the UHI effect!' propaganda.

It's not complicated. Just how many lead paint chips did you eat as a child?

Your graphic didn't challenge that fact. You'd look less stupid if you'd occasionally look at your own memes.

Just where did you get that graphic? A reverse image search on it came up with nothing, so it must be from a very obscure source.
I just showed you the curves, dummy.
 
When?


So it seems that you haven't ever had a chemistry class?

CO2 is a known greenhouse gas. Meaning it CAN AND DOES cause warming at the surface. But CO2 can also LAG increased temperatures because when you raise the temperature the oceans get warmer and dissolved CO2 comes out of solution.

I know that's a lot of extremely complex science for you there, but if you read it a couple times you may understand.


Wrong. By a HUGE margin. CO2 and H2O are primary gases responsible for the earth's surface temperature. If our atmosphere lacked greenhouse gases and ONLY had O2 and N2 the average surface temperature would be about -20degC.
The oceans get warmer and the CO2 that disassociates almost instantly upon contact with water, er, reforms as CO2, Terminator like, to wreck new havoc on the planet. This new learning amazes me!
 
Indeed it is the presence of an atmosphere that causes that. CO2 is a minor greenhouse gas. Water vapor is the dominant greenhouse gas.
If the focus was on water vapor, instead of trying to stop Western civilization, Greta and the AGW Cult would be reduced to shrieking about Americans taking too long in the shower
 
No one argues against that. But the point is that paleoclimatologists have already investigated these things and that "variability" that happens naturally usually happens for a reason.

The fact of the matter is that the NATURAL FORCINGS cannot currently account for the warming we've seen in the last 60 years. But if we include human activities the data starts to make sense.

Here's a graph from grida.no that makes the case:

OzCL00O.jpg

Here's what you are looking at:

In Graph (A) you see what temperatures SHOULD have done using only natural forcings (solar etc.) The black line is the fit. The RED LINE is what the temperatures ACTUALLY DID. Note how they diverge.

Graph (B) is what the graph looks like if you just rely on "human factors" (human produced GHG's and land use changes etc.). The fit is MUCH better but not perfect.

Graph (C) shows both natural and human forcings. The fit is VERY GOOD.

Natural forcings play something of a role (obviously) but they cannot explain the warming we've seen the last 60 years by themselves. In fact human forcings explain a LOT more of the data than natural.
The red line was flattened to make the warming in the 1930s disappear.
 

Forum List

Back
Top