Democrats have nothing to offer Americans but division; race and class warfare

A version of this article appears in print on September 11, 2015, on page A19 of the New York edition with the headline: Bush’s Plan Gives to the Poor and the Rich]
lol.
Pwned again.
LOL. Sure it does.
A tax plan that disproportionately favors the wealthy and would cause their to have to be gutted social services to pay off the rich and their tax breaks.
That wasnt even coherent.
Since the top 40% of taxpayers pay virtually all income tax it is no surprise that a cut in income taxes would benefit them.
We need to raise taxes on the bottom 40% so they actually pay something.
LOL. How much taxable income do you think the bottom 40% takes in? How much wealth do you think they own? Making the bottom 40% pay more taxes is spitting on them for no reason, and it wouldn't make a difference at all. :finger3:
They have lots of taxable income, dumbshit. Because there are lots of them. Again you confuse income and wealth, because you're an ignoramus. They dont pay ANY taxes. In fact they get back more than they pay in. If they're going to benefit from this country and all it offers shouldnt they be paying something? You scream about big corporations not paying their fair share, what about the freeloading bottom 40% of wage earners?
How much income do they take in compared to the other 60%?
Do some basic math.
An Economic Cancer: The Top 1% Earns More Than the Bottom 50%
Income Inequality | Inequality.org
The U.S. ranks around the 30th percentile in income inequality globally, meaning 70% of countries have a more equal income distribution.[4] U.S. federal tax and transfer policies are progressive and therefore reduce income inequality measured after taxes and transfers.[5] Tax and transfer policies together reduced income inequality slightly more in 2011 than in 1979.[1]
The top 1% of income earners received approximately 20% of the pre-tax income in 2013,[22] versus approximately 10% from 1950 to 1980.[2][23][24] The top 1% is not homogeneous, with the very top income households pulling away from others in the top 1%. For example, the top 0.1% of households received approximately 10% of the pre-tax income in 2013, versus approximately 3-4% between 1951-1981.[22][25] Most of the growth in income inequality has been between the middle class and top earners, with the disparity widening the further one goes up in the income distribution.[26] According to IRS data, adjusted gross income (AGI) of $388,900 was required to be in the top 1% in 2011.[27]

To put this change into perspective, if the US had the same income distribution it had in 1979, each family in the bottom 80% of the income distribution would have $11,000 more per year in income on average, or $916 per month.[28] Half of the U.S. population lives in poverty or is low-income, according to U.S. Census data.[29]
U.S. income inequality, on rise for decades, is now highest since 1928
"
In 1928, the top 1% of families received 23.9% of all pretax income, while the bottom 90% received 50.7%. But the Depression and World War II dramatically reshaped the nation’s income distribution: By 1944 the top 1%’s share was down to 11.3%, while the bottom 90% were receiving 67.5%, levels that would remain more or less constant for the next three decades.

But starting in the mid- to late 1970s, the uppermost tier’s income share began rising dramatically, while that of the bottom 90% started to fall. The top 1% took heavy hits from the dot-com crash and the Great Recession but recovered fairly quickly: Saez’s preliminary estimates for 2012 (which will be updated next month) have that group receiving nearly 22.5% of all pretax income, while the bottom 90%’s share is below 50% for the first time ever (49.6%, to be precise).
"
 
12039625_10156006440965328_3040567380855733276_n.jpg
<---No Brains for Me Lord I am good ...the GOP
 
The left also uses selective morality. Example: The global warming shit is a moral outrage, but "crunching" babies and selling their organs is "a woman's right to choose." :lol:

Funny they're too stupid to see the idiocy of argument.
 
lol.
Pwned again.
LOL. Sure it does.
A tax plan that disproportionately favors the wealthy and would cause their to have to be gutted social services to pay off the rich and their tax breaks.
That wasnt even coherent.
Since the top 40% of taxpayers pay virtually all income tax it is no surprise that a cut in income taxes would benefit them.
We need to raise taxes on the bottom 40% so they actually pay something.
LOL. How much taxable income do you think the bottom 40% takes in? How much wealth do you think they own? Making the bottom 40% pay more taxes is spitting on them for no reason, and it wouldn't make a difference at all. :finger3:
They have lots of taxable income, dumbshit. Because there are lots of them. Again you confuse income and wealth, because you're an ignoramus. They dont pay ANY taxes. In fact they get back more than they pay in. If they're going to benefit from this country and all it offers shouldnt they be paying something? You scream about big corporations not paying their fair share, what about the freeloading bottom 40% of wage earners?
How much income do they take in compared to the other 60%?
Do some basic math.
An Economic Cancer: The Top 1% Earns More Than the Bottom 50%
Income Inequality | Inequality.org
The U.S. ranks around the 30th percentile in income inequality globally, meaning 70% of countries have a more equal income distribution.[4] U.S. federal tax and transfer policies are progressive and therefore reduce income inequality measured after taxes and transfers.[5] Tax and transfer policies together reduced income inequality slightly more in 2011 than in 1979.[1]
The top 1% of income earners received approximately 20% of the pre-tax income in 2013,[22] versus approximately 10% from 1950 to 1980.[2][23][24] The top 1% is not homogeneous, with the very top income households pulling away from others in the top 1%. For example, the top 0.1% of households received approximately 10% of the pre-tax income in 2013, versus approximately 3-4% between 1951-1981.[22][25] Most of the growth in income inequality has been between the middle class and top earners, with the disparity widening the further one goes up in the income distribution.[26] According to IRS data, adjusted gross income (AGI) of $388,900 was required to be in the top 1% in 2011.[27]

To put this change into perspective, if the US had the same income distribution it had in 1979, each family in the bottom 80% of the income distribution would have $11,000 more per year in income on average, or $916 per month.[28] Half of the U.S. population lives in poverty or is low-income, according to U.S. Census data.[29]
The top 1% of income earners received approximately 20% of the pre-tax income in 2013,[22] versus approximately 10% from 1950 to 1980.[2][23][24] The top 1% is not homogeneous, with the very top income households pulling away from others in the top 1%. For example, the top 0.1% of households received approximately 10% of the pre-tax income in 2013, versus approximately 3-4% between 1951-1981.[22][25] Most of the growth in income inequality has been between the middle class and top earners, with the disparity widening the further one goes up in the income distribution.[26] According to IRS data, adjusted gross income (AGI) of $388,900 was required to be in the top 1% in 2011.[27]

To put this change into perspective, if the US had the same income distribution it had in 1979, each family in the bottom 80% of the income distribution would have $11,000 more per year in income on average, or $916 per month.[28] Half of the U.S. population lives in poverty or is low-income, according to U.S. Census data.[29]
U.S. income inequality, on rise for decades, is now highest since 1928
"
In 1928, the top 1% of families received 23.9% of all pretax income, while the bottom 90% received 50.7%. But the Depression and World War II dramatically reshaped the nation’s income distribution: By 1944 the top 1%’s share was down to 11.3%, while the bottom 90% were receiving 67.5%, levels that would remain more or less constant for the next three decades.

But starting in the mid- to late 1970s, the uppermost tier’s income share began rising dramatically, while that of the bottom 90% started to fall. The top 1% took heavy hits from the dot-com crash and the Great Recession but recovered fairly quickly: Saez’s preliminary estimates for 2012 (which will be updated next month) have that group receiving nearly 22.5% of all pretax income, while the bottom 90%’s share is below 50% for the first time ever (49.6%, to be precise).
"
So the bottom 40% shouldnt pay anything? Does that sound fair to you?
 
lol.
Pwned again.
LOL. Sure it does.
A tax plan that disproportionately favors the wealthy and would cause their to have to be gutted social services to pay off the rich and their tax breaks.
That wasnt even coherent.
Since the top 40% of taxpayers pay virtually all income tax it is no surprise that a cut in income taxes would benefit them.
We need to raise taxes on the bottom 40% so they actually pay something.
LOL. How much taxable income do you think the bottom 40% takes in? How much wealth do you think they own? Making the bottom 40% pay more taxes is spitting on them for no reason, and it wouldn't make a difference at all. :finger3:
They have lots of taxable income, dumbshit. Because there are lots of them. Again you confuse income and wealth, because you're an ignoramus. They dont pay ANY taxes. In fact they get back more than they pay in. If they're going to benefit from this country and all it offers shouldnt they be paying something? You scream about big corporations not paying their fair share, what about the freeloading bottom 40% of wage earners?
How much income do they take in compared to the other 60%?
Do some basic math.
An Economic Cancer: The Top 1% Earns More Than the Bottom 50%
Income Inequality | Inequality.org
The U.S. ranks around the 30th percentile in income inequality globally, meaning 70% of countries have a more equal income distribution.[4] U.S. federal tax and transfer policies are progressive and therefore reduce income inequality measured after taxes and transfers.[5] Tax and transfer policies together reduced income inequality slightly more in 2011 than in 1979.[1]
The top 1% of income earners received approximately 20% of the pre-tax income in 2013,[22] versus approximately 10% from 1950 to 1980.[2][23][24] The top 1% is not homogeneous, with the very top income households pulling away from others in the top 1%. For example, the top 0.1% of households received approximately 10% of the pre-tax income in 2013, versus approximately 3-4% between 1951-1981.[22][25] Most of the growth in income inequality has been between the middle class and top earners, with the disparity widening the further one goes up in the income distribution.[26] According to IRS data, adjusted gross income (AGI) of $388,900 was required to be in the top 1% in 2011.[27]

To put this change into perspective, if the US had the same income distribution it had in 1979, each family in the bottom 80% of the income distribution would have $11,000 more per year in income on average, or $916 per month.[28] Half of the U.S. population lives in poverty or is low-income, according to U.S. Census data.[29]
The top 1% of income earners received approximately 20% of the pre-tax income in 2013,[22] versus approximately 10% from 1950 to 1980.[2][23][24] The top 1% is not homogeneous, with the very top income households pulling away from others in the top 1%. For example, the top 0.1% of households received approximately 10% of the pre-tax income in 2013, versus approximately 3-4% between 1951-1981.[22][25] Most of the growth in income inequality has been between the middle class and top earners, with the disparity widening the further one goes up in the income distribution.[26] According to IRS data, adjusted gross income (AGI) of $388,900 was required to be in the top 1% in 2011.[27]

To put this change into perspective, if the US had the same income distribution it had in 1979, each family in the bottom 80% of the income distribution would have $11,000 more per year in income on average, or $916 per month.[28] Half of the U.S. population lives in poverty or is low-income, according to U.S. Census data.[29]
U.S. income inequality, on rise for decades, is now highest since 1928
"
In 1928, the top 1% of families received 23.9% of all pretax income, while the bottom 90% received 50.7%. But the Depression and World War II dramatically reshaped the nation’s income distribution: By 1944 the top 1%’s share was down to 11.3%, while the bottom 90% were receiving 67.5%, levels that would remain more or less constant for the next three decades.

But starting in the mid- to late 1970s, the uppermost tier’s income share began rising dramatically, while that of the bottom 90% started to fall. The top 1% took heavy hits from the dot-com crash and the Great Recession but recovered fairly quickly: Saez’s preliminary estimates for 2012 (which will be updated next month) have that group receiving nearly 22.5% of all pretax income, while the bottom 90%’s share is below 50% for the first time ever (49.6%, to be precise).
"


Maybe learn to not resent successful people so much. :)
 
LOL. Sure it does.
A tax plan that disproportionately favors the wealthy and would cause their to have to be gutted social services to pay off the rich and their tax breaks.
That wasnt even coherent.
Since the top 40% of taxpayers pay virtually all income tax it is no surprise that a cut in income taxes would benefit them.
We need to raise taxes on the bottom 40% so they actually pay something.
LOL. How much taxable income do you think the bottom 40% takes in? How much wealth do you think they own? Making the bottom 40% pay more taxes is spitting on them for no reason, and it wouldn't make a difference at all. :finger3:
They have lots of taxable income, dumbshit. Because there are lots of them. Again you confuse income and wealth, because you're an ignoramus. They dont pay ANY taxes. In fact they get back more than they pay in. If they're going to benefit from this country and all it offers shouldnt they be paying something? You scream about big corporations not paying their fair share, what about the freeloading bottom 40% of wage earners?
How much income do they take in compared to the other 60%?
Do some basic math.
An Economic Cancer: The Top 1% Earns More Than the Bottom 50%
Income Inequality | Inequality.org
The U.S. ranks around the 30th percentile in income inequality globally, meaning 70% of countries have a more equal income distribution.[4] U.S. federal tax and transfer policies are progressive and therefore reduce income inequality measured after taxes and transfers.[5] Tax and transfer policies together reduced income inequality slightly more in 2011 than in 1979.[1]
The top 1% of income earners received approximately 20% of the pre-tax income in 2013,[22] versus approximately 10% from 1950 to 1980.[2][23][24] The top 1% is not homogeneous, with the very top income households pulling away from others in the top 1%. For example, the top 0.1% of households received approximately 10% of the pre-tax income in 2013, versus approximately 3-4% between 1951-1981.[22][25] Most of the growth in income inequality has been between the middle class and top earners, with the disparity widening the further one goes up in the income distribution.[26] According to IRS data, adjusted gross income (AGI) of $388,900 was required to be in the top 1% in 2011.[27]

To put this change into perspective, if the US had the same income distribution it had in 1979, each family in the bottom 80% of the income distribution would have $11,000 more per year in income on average, or $916 per month.[28] Half of the U.S. population lives in poverty or is low-income, according to U.S. Census data.[29]
The top 1% of income earners received approximately 20% of the pre-tax income in 2013,[22] versus approximately 10% from 1950 to 1980.[2][23][24] The top 1% is not homogeneous, with the very top income households pulling away from others in the top 1%. For example, the top 0.1% of households received approximately 10% of the pre-tax income in 2013, versus approximately 3-4% between 1951-1981.[22][25] Most of the growth in income inequality has been between the middle class and top earners, with the disparity widening the further one goes up in the income distribution.[26] According to IRS data, adjusted gross income (AGI) of $388,900 was required to be in the top 1% in 2011.[27]

To put this change into perspective, if the US had the same income distribution it had in 1979, each family in the bottom 80% of the income distribution would have $11,000 more per year in income on average, or $916 per month.[28] Half of the U.S. population lives in poverty or is low-income, according to U.S. Census data.[29]
U.S. income inequality, on rise for decades, is now highest since 1928
"
In 1928, the top 1% of families received 23.9% of all pretax income, while the bottom 90% received 50.7%. But the Depression and World War II dramatically reshaped the nation’s income distribution: By 1944 the top 1%’s share was down to 11.3%, while the bottom 90% were receiving 67.5%, levels that would remain more or less constant for the next three decades.

But starting in the mid- to late 1970s, the uppermost tier’s income share began rising dramatically, while that of the bottom 90% started to fall. The top 1% took heavy hits from the dot-com crash and the Great Recession but recovered fairly quickly: Saez’s preliminary estimates for 2012 (which will be updated next month) have that group receiving nearly 22.5% of all pretax income, while the bottom 90%’s share is below 50% for the first time ever (49.6%, to be precise).
"
So the bottom 40% shouldnt pay anything? Does that sound fair to you?
Oh, but they do pay taxes, it's just their income is so little that raising taxes on them would just push them down even more.
 
LOL. Sure it does.
A tax plan that disproportionately favors the wealthy and would cause their to have to be gutted social services to pay off the rich and their tax breaks.
That wasnt even coherent.
Since the top 40% of taxpayers pay virtually all income tax it is no surprise that a cut in income taxes would benefit them.
We need to raise taxes on the bottom 40% so they actually pay something.
LOL. How much taxable income do you think the bottom 40% takes in? How much wealth do you think they own? Making the bottom 40% pay more taxes is spitting on them for no reason, and it wouldn't make a difference at all. :finger3:
They have lots of taxable income, dumbshit. Because there are lots of them. Again you confuse income and wealth, because you're an ignoramus. They dont pay ANY taxes. In fact they get back more than they pay in. If they're going to benefit from this country and all it offers shouldnt they be paying something? You scream about big corporations not paying their fair share, what about the freeloading bottom 40% of wage earners?
How much income do they take in compared to the other 60%?
Do some basic math.
An Economic Cancer: The Top 1% Earns More Than the Bottom 50%
Income Inequality | Inequality.org
The U.S. ranks around the 30th percentile in income inequality globally, meaning 70% of countries have a more equal income distribution.[4] U.S. federal tax and transfer policies are progressive and therefore reduce income inequality measured after taxes and transfers.[5] Tax and transfer policies together reduced income inequality slightly more in 2011 than in 1979.[1]
The top 1% of income earners received approximately 20% of the pre-tax income in 2013,[22] versus approximately 10% from 1950 to 1980.[2][23][24] The top 1% is not homogeneous, with the very top income households pulling away from others in the top 1%. For example, the top 0.1% of households received approximately 10% of the pre-tax income in 2013, versus approximately 3-4% between 1951-1981.[22][25] Most of the growth in income inequality has been between the middle class and top earners, with the disparity widening the further one goes up in the income distribution.[26] According to IRS data, adjusted gross income (AGI) of $388,900 was required to be in the top 1% in 2011.[27]

To put this change into perspective, if the US had the same income distribution it had in 1979, each family in the bottom 80% of the income distribution would have $11,000 more per year in income on average, or $916 per month.[28] Half of the U.S. population lives in poverty or is low-income, according to U.S. Census data.[29]
The top 1% of income earners received approximately 20% of the pre-tax income in 2013,[22] versus approximately 10% from 1950 to 1980.[2][23][24] The top 1% is not homogeneous, with the very top income households pulling away from others in the top 1%. For example, the top 0.1% of households received approximately 10% of the pre-tax income in 2013, versus approximately 3-4% between 1951-1981.[22][25] Most of the growth in income inequality has been between the middle class and top earners, with the disparity widening the further one goes up in the income distribution.[26] According to IRS data, adjusted gross income (AGI) of $388,900 was required to be in the top 1% in 2011.[27]

To put this change into perspective, if the US had the same income distribution it had in 1979, each family in the bottom 80% of the income distribution would have $11,000 more per year in income on average, or $916 per month.[28] Half of the U.S. population lives in poverty or is low-income, according to U.S. Census data.[29]
U.S. income inequality, on rise for decades, is now highest since 1928
"
In 1928, the top 1% of families received 23.9% of all pretax income, while the bottom 90% received 50.7%. But the Depression and World War II dramatically reshaped the nation’s income distribution: By 1944 the top 1%’s share was down to 11.3%, while the bottom 90% were receiving 67.5%, levels that would remain more or less constant for the next three decades.

But starting in the mid- to late 1970s, the uppermost tier’s income share began rising dramatically, while that of the bottom 90% started to fall. The top 1% took heavy hits from the dot-com crash and the Great Recession but recovered fairly quickly: Saez’s preliminary estimates for 2012 (which will be updated next month) have that group receiving nearly 22.5% of all pretax income, while the bottom 90%’s share is below 50% for the first time ever (49.6%, to be precise).
"

Maybe learn to not resent successful people so much. :)
This has nothing to do with resenting successful people, these are facts that you are free to look at. Trickle down garbage doesn't work, never has.
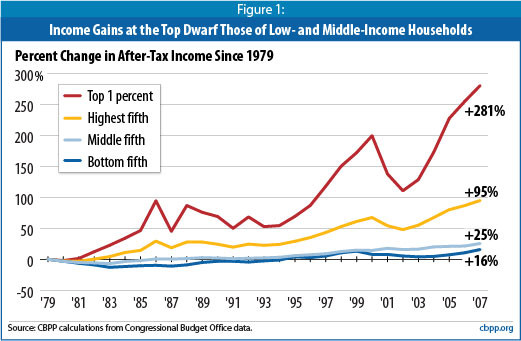
"But starting in the mid- to late 1970s, the uppermost tier’s income share began rising dramatically, while that of the bottom 90% started to fall. The top 1% took heavy hits from the dot-com crash and the Great Recession but recovered fairly quickly: Saez’s preliminary estimates for 2012 (which will be updated next month) have that group receiving nearly 22.5% of all pretax income, while the bottom 90%’s share is below 50% for the first time ever (49.6%, to be precise)."
Suck on that.
 
Being an isolationist the only positive thing about a Democratic president is the Republican rightful caution to back them in any war effort. That ranks rather a high priority in my selection for president and is why I abstained when McCain was nominated and would do the same if Lindsay Graham, heaven forbid, got the nomination.
 
That wasnt even coherent.
Since the top 40% of taxpayers pay virtually all income tax it is no surprise that a cut in income taxes would benefit them.
We need to raise taxes on the bottom 40% so they actually pay something.
LOL. How much taxable income do you think the bottom 40% takes in? How much wealth do you think they own? Making the bottom 40% pay more taxes is spitting on them for no reason, and it wouldn't make a difference at all. :finger3:
They have lots of taxable income, dumbshit. Because there are lots of them. Again you confuse income and wealth, because you're an ignoramus. They dont pay ANY taxes. In fact they get back more than they pay in. If they're going to benefit from this country and all it offers shouldnt they be paying something? You scream about big corporations not paying their fair share, what about the freeloading bottom 40% of wage earners?
How much income do they take in compared to the other 60%?
Do some basic math.
An Economic Cancer: The Top 1% Earns More Than the Bottom 50%
Income Inequality | Inequality.org
The U.S. ranks around the 30th percentile in income inequality globally, meaning 70% of countries have a more equal income distribution.[4] U.S. federal tax and transfer policies are progressive and therefore reduce income inequality measured after taxes and transfers.[5] Tax and transfer policies together reduced income inequality slightly more in 2011 than in 1979.[1]
The top 1% of income earners received approximately 20% of the pre-tax income in 2013,[22] versus approximately 10% from 1950 to 1980.[2][23][24] The top 1% is not homogeneous, with the very top income households pulling away from others in the top 1%. For example, the top 0.1% of households received approximately 10% of the pre-tax income in 2013, versus approximately 3-4% between 1951-1981.[22][25] Most of the growth in income inequality has been between the middle class and top earners, with the disparity widening the further one goes up in the income distribution.[26] According to IRS data, adjusted gross income (AGI) of $388,900 was required to be in the top 1% in 2011.[27]

To put this change into perspective, if the US had the same income distribution it had in 1979, each family in the bottom 80% of the income distribution would have $11,000 more per year in income on average, or $916 per month.[28] Half of the U.S. population lives in poverty or is low-income, according to U.S. Census data.[29]
The top 1% of income earners received approximately 20% of the pre-tax income in 2013,[22] versus approximately 10% from 1950 to 1980.[2][23][24] The top 1% is not homogeneous, with the very top income households pulling away from others in the top 1%. For example, the top 0.1% of households received approximately 10% of the pre-tax income in 2013, versus approximately 3-4% between 1951-1981.[22][25] Most of the growth in income inequality has been between the middle class and top earners, with the disparity widening the further one goes up in the income distribution.[26] According to IRS data, adjusted gross income (AGI) of $388,900 was required to be in the top 1% in 2011.[27]

To put this change into perspective, if the US had the same income distribution it had in 1979, each family in the bottom 80% of the income distribution would have $11,000 more per year in income on average, or $916 per month.[28] Half of the U.S. population lives in poverty or is low-income, according to U.S. Census data.[29]
U.S. income inequality, on rise for decades, is now highest since 1928
"
In 1928, the top 1% of families received 23.9% of all pretax income, while the bottom 90% received 50.7%. But the Depression and World War II dramatically reshaped the nation’s income distribution: By 1944 the top 1%’s share was down to 11.3%, while the bottom 90% were receiving 67.5%, levels that would remain more or less constant for the next three decades.

But starting in the mid- to late 1970s, the uppermost tier’s income share began rising dramatically, while that of the bottom 90% started to fall. The top 1% took heavy hits from the dot-com crash and the Great Recession but recovered fairly quickly: Saez’s preliminary estimates for 2012 (which will be updated next month) have that group receiving nearly 22.5% of all pretax income, while the bottom 90%’s share is below 50% for the first time ever (49.6%, to be precise).
"


Maybe learn to not resent successful people so much. :)
This has nothing to do with resenting successful people, these are facts that you are free to look at. Trickle down garbage doesn't work, never has.
"But starting in the mid- to late 1970s, the uppermost tier’s income share began rising dramatically, while that of the bottom 90% started to fall. The top 1% took heavy hits from the dot-com crash and the Great Recession but recovered fairly quickly: Saez’s preliminary estimates for 2012 (which will be updated next month) have that group receiving nearly 22.5% of all pretax income, while the bottom 90%’s share is below 50% for the first time ever (49.6%, to be precise)."
Suck on that.


You realize the problems you mention have accelerated under Obama and his policies? You know that right? Now you are saying the problem is a result of "trickle down" economics. Funny.....but that is a term from the 1980's.

Are you saying Obama's economic policies are "trickle down" economics? What exactly are you saying and why has the problem accelerated under Obama?
You do realize, that bush took office in 2008, almost right when bush dumped the recession on him. We are recovering better then most countries, Obama has tried to raise taxes to alleviate inequality, he has tried to help small businesses, conservatives aren't letting him, or forcing him to make ridiculous compromises. Conservatives don't want to bring home jobs, they don't want to help veterans. His policies aren't trickle down economics, but great job trying to spew idiocy.

No need to raise taxes. He can find the money within his existing budget. Make cuts somewhere else to pay for it

-Geaux
 
Thank you for admitting you lied in your earlier post.
Jeb Bush has rolled out a very comprehensive plan on taxes and regulation.

Under Bushes plan, wouldn't VW be able to keep the deception up longer?

Bush only had one plan.....tax cuts for the wealthy. All the other bad shit came after he asked god what to do.
You understand that Jeb Bush was never president, right?

That ain't the half of it.............Jeb Bush will never be president!

 
You understand that Jeb Bush was never president, right?
Jeb bush is a moron neo-con who wants to expand his brother's disaster.
And we hear the voice of ignorance and stupidity once more.
http://www.nytimes.com/2015/09/10/u...an-is-a-large-tax-cut-for-the-wealthiest.html
A version of this article appears in print on September 11, 2015, on page A19 of the New York edition with the headline: Bush’s Plan Gives to the Poor and the Rich]
lol.
Pwned again.
LOL. Sure it does.
A tax plan that disproportionately favors the wealthy and would cause their to have to be gutted social services to pay off the rich and their tax breaks.

Spot On!!!
This shit started when Reagan slashed tax rates for the wealthy to pre depression levels, never cut spending a goddam dime thereby borrowing $3 trillion from foreign banks and effectively handing it to the richest people in this country. Rich people used to pay their way. Now...they're freeloaders.

6a00d83451c45669e201675ecf1529970b-550wi


Look closely at the 1% line after Clinton's two terms and just before Bush cut taxes for the rich twice:


growth-in-income-inequality1.jpg


.................................Total U S Debt.......................................


09/30/2009 $11,909,829,003,511.75(80% Of All Debt Across 232 Years Borrowed By Reagan And Bushes)
09/30/2008 $10,024,724,896,912.49(Times Square Debt Clock Modified To Accommodate Tens of Trillions)
09/30/2007 $9,007,653,372,262.48
09/30/2006 $8,506,973,899,215.23
09/30/2005 $7,932,709,661,723.50
09/30/2004 $7,379,052,696,330.32
09/30/2003 $6,783,231,062,743.62(Second Bush Tax Cuts Enacted Using Reconciliation)
09/30/2002 $6,228,235,965,597.16
09/30/2001 $5,807,463,412,200.06(First Bush Tax Cuts Enacted Using Reconciliation)
09/30/2000 $5,674,178,209,886.86(Administration And Congress Arguing About How To Use Surplus)
09/30/1999 $5,656,270,901,615.43(First Surplus Generated...On Track To Pay Off Debt By 2012)
09/30/1998 $5,526,193,008,897.62
09/30/1997 $5,413,146,011,397.34
09/30/1996 $5,224,810,939,135.73
09/29/1995 $4,973,982,900,709.39
09/30/1994 $4,692,749,910,013.32
09/30/1993 $4,411,488,883,139.38 ( Debt Quadrupled By Reagan/Bush41)(President Clinton raised tax rates while he still had a Democrat congress)
09/30/1992 $4,064,620,655,521.66
09/30/1991 $3,665,303,351,697.03
09/28/1990 $3,233,313,451,777.25
09/29/1989 $2,857,430,960,187.32
09/30/1988 $2,602,337,712,041.16
09/30/1987 $2,350,276,890,953.00
09/30/1986 $2,125,302,616,658.42
09/30/1985 $1,823,103,000,000.00
09/30/1984 $1,572,266,000,000.00
09/30/1983 $1,377,210,000,000.00
09/30/1982 $1,142,034,000,000.00(Total Debt Passes $1 Trillion)((Reagan Slashed Tax Rates To Pre Depression Levels)
09/30/1981 $997,855,000,000.00
 
Last edited:
The left also uses selective morality. Example: The global warming shit is a moral outrage, but "crunching" babies and selling their organs is "a woman's right to choose." :lol:

Funny they're too stupid to see the idiocy of argument.

I have a question for you. When you see a neighbor lady take a strange man into her house. Do you worry as much about that as you seem to worry about other people's business here? Get A Life And STFU!!
 
You start a divisive thread stating that the only thing democrats have to offer is divisiveness.....


How ironic!
As far as I can figure, the conservative rightwingers on this board are completely oblivious regarding their own shortcomings, of which there are a great many. Completely unaware.


it's only divisive because you losers dwell in circles where you preach to your own choir; and are in complete denial over your own intolerance. you stick to a narrative that demonizes others. i'm not being divisive for pointing out the hypocrisy of the intolerant Left, i'm just keeping it real.....
 
The left also uses selective morality. Example: The global warming shit is a moral outrage, but "crunching" babies and selling their organs is "a woman's right to choose." :lol:

Funny they're too stupid to see the idiocy of argument.

I have a question for you. When you see a neighbor lady take a strange man into her house. Do you worry as much about that as you seem to worry about other people's business here? Get A Life And STFU!!


well if you saw her go in there then you a nosy loser too dummy.

go cry
 

Forum List

Back
Top