bedowin62
Gold Member
- Feb 6, 2014
- 17,997
- 2,025
- Thread starter
- #261
LOL. Sure it does.http://www.nytimes.com/2015/09/10/u...an-is-a-large-tax-cut-for-the-wealthiest.htmlAnd we hear the voice of ignorance and stupidity once more.Jeb bush is a moron neo-con who wants to expand his brother's disaster.lol.A version of this article appears in print on September 11, 2015, on page A19 of the New York edition with the headline: Bush’s Plan Gives to the Poor and the Rich]
Pwned again.
A tax plan that disproportionately favors the wealthy and would cause their to have to be gutted social services to pay off the rich and their tax breaks.
Spot On!!!
This shit started when Reagan slashed tax rates for the wealthy to pre depression levels, never cut spending a goddam dime thereby borrowing $3 trillion from foreign banks and effectively handing it to the richest people in this country. Rich people used to pay their way. Now...they're freeloaders.

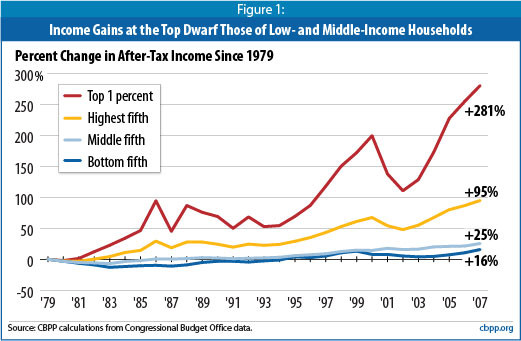
Look closely at the 1% line after Clinton's two terms and just before Bush cut taxes for the rich twice:
.................................Total U S Debt.......................................
09/30/2009 $11,909,829,003,511.75(80% Of All Debt Across 232 Years Borrowed By Reagan And Bushes)
09/30/2008 $10,024,724,896,912.49(Times Square Debt Clock Modified To Accommodate Tens of Trillions)
09/30/2007 $9,007,653,372,262.48
09/30/2006 $8,506,973,899,215.23
09/30/2005 $7,932,709,661,723.50
09/30/2004 $7,379,052,696,330.32
09/30/2003 $6,783,231,062,743.62(Second Bush Tax Cuts Enacted Using Reconciliation)
09/30/2002 $6,228,235,965,597.16
09/30/2001 $5,807,463,412,200.06(First Bush Tax Cuts Enacted Using Reconciliation)
09/30/2000 $5,674,178,209,886.86(Administration And Congress Arguing About How To Use Surplus)
09/30/1999 $5,656,270,901,615.43(First Surplus Generated...On Track To Pay Off Debt By 2012)
09/30/1998 $5,526,193,008,897.62
09/30/1997 $5,413,146,011,397.34
09/30/1996 $5,224,810,939,135.73
09/29/1995 $4,973,982,900,709.39
09/30/1994 $4,692,749,910,013.32
09/30/1993 $4,411,488,883,139.38 ( Debt Quadrupled By Reagan/Bush41)(President Clinton raised tax rates while he still had a Democrat congress)
09/30/1992 $4,064,620,655,521.66
09/30/1991 $3,665,303,351,697.03
09/28/1990 $3,233,313,451,777.25
09/29/1989 $2,857,430,960,187.32
09/30/1988 $2,602,337,712,041.16
09/30/1987 $2,350,276,890,953.00
09/30/1986 $2,125,302,616,658.42
09/30/1985 $1,823,103,000,000.00
09/30/1984 $1,572,266,000,000.00
09/30/1983 $1,377,210,000,000.00
09/30/1982 $1,142,034,000,000.00(Total Debt Passes $1 Trillion)((Reagan Slashed Tax Rates To Pre Depression Levels)
09/30/1981 $997,855,000,000.00
here's what none of your charts say........................................
UNDER PROGRESSIVES THE VERY RICHEST GOT RICHER AND THE POOREST GOT POORER
both got richer and poorer AT A FASTER PACE UNDER OBAMA/PROGRESSIVES then they were getting under Bush and Republicans
libs are losers who lie......... TO THEMSELVES

")


