"Fingerprint" of Greenland ice melt seen in satellite sea level data

Funny thing about this "fingerprint science" for which NO COURSES are taught in universities - it would show only "ice losses" -- but NEVER "ice gains".

See below about gains. As to their being no courses taught: this is fucking brand new research. If it were taught in university, there wouldn't have been much need for the research. I don't know what to say, dude. That's a bit lame.

So the Greenland ice could LOSE and GAIN every 3rd year -- and it never would be accounted for.

And the idea of fitting ONE (fairly) linear process to another linear process is iffy at best. It's NOT proof of causation. Bet I'll concede that Greenland ice loss HAS raised sea levels and they would REMAIN RAISED even if Greenland doubled in ice next decade.
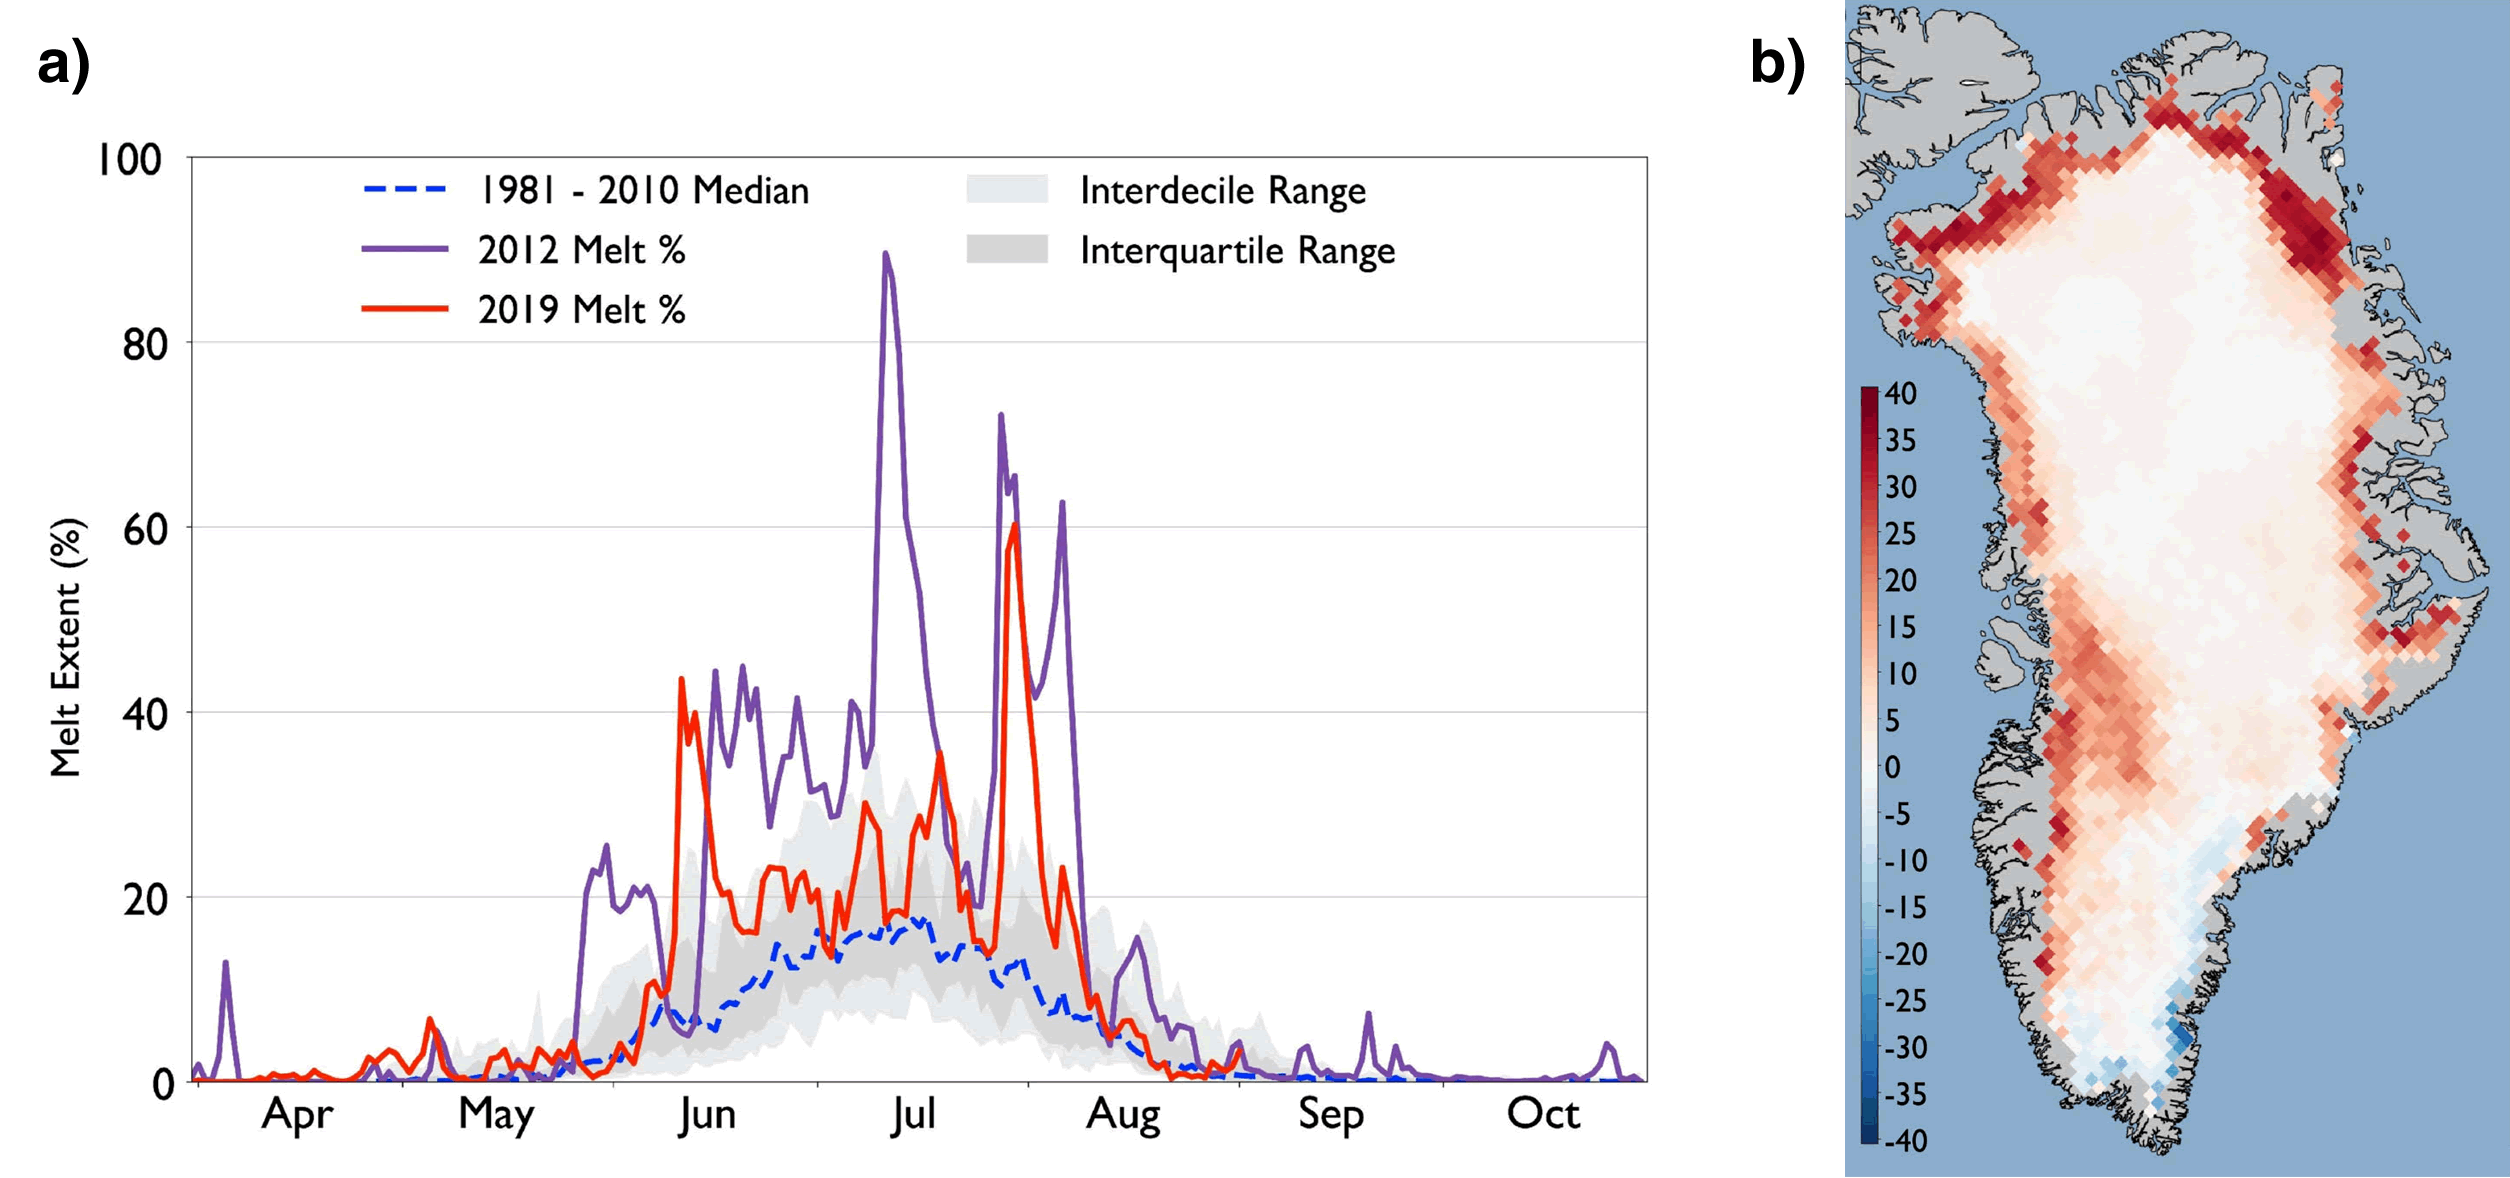
When, exactly, since the dawn of satellite observations, has Greenland gained ice?

1666754453511.png

1666754505968.png


And where does this study indicate that it would not be able to detect sea level decline had it taken place?

Abstract​

Rapid melting of ice sheets and glaciers drives a unique geometry, or fingerprint, of sea level change. However, the detection of individual fingerprints has been challenging because of sparse observations at high latitudes and the difficulty of disentangling ocean dynamic variability from the signal. We predict the fingerprint of Greenland Ice Sheet (GrIS) melt using recent ice mass loss estimates from radar altimetry data and model reconstructions of nearby glaciers and compare this prediction to an independent, altimetry-derived sea surface height trend corrected for ocean dynamic variability in the region adjacent to the ice sheet. A statistically significant correlation between the two fields (P < 0.001) provides an unambiguous observational detection of the near-field sea level fingerprint of recent GrIS melting in our warming world.
 
Last edited:
"Intend" is the right word here ... as far as I know, only one coal-fired power plant has been forcibly shut down by gubbermint ... so on the ground, we're adding capacity, not replacing ...

"Conservation" is a dirty word ... both sides agree ...
Nothing wrong with conservation but their intention to replace fossil fuels with renewables is doomed to fail. It can’t be practically done which is why they can’t show how it will be done.
 
Are you that stupid? That is PRECISELY what he is challenging.

Others are challenging your interpretation of this data ... can you explain the physics behind these graphs? ...

Let's use a 12.5 µm photon ... and let's strike a CO2 molecule with this photon ... what happens? ...
 
Nothing wrong with conservation but their intention to replace fossil fuels with renewables is doomed to fail. It can’t be practically done which is why they can’t show how it will be done.

We're NOT replacing fossil fuel energy with renewables ... don't you understand Englishing? ... we're using MORE energy ... we don't need a Ford F-350 if it's driven mostly empty all the time, the EV will get you to the tavern and back cheaper ...

I'm not asking for much ... 90% fewer passenger vehicles, 90% less airline travel and 90% less meat consumption ... (I see no point discussing baby making to people who don't have babies, so outside Western Europe and Anglo America, stop having sex) ...
That’s their plan. Zero emission electrical generation by 2050.
 
But that’s their plan… to have 100% electrical generation from renewables by 2050. Where have you been?
but they haven't yet, so your entire argument is wrong at this time.
 
Funny thing about this "fingerprint science" for which NO COURSES are taught in universities - it would show only "ice losses" -- but NEVER "ice gains". So the Greenland ice could LOSE and GAIN every 3rd year -- and it never would be accounted for.

And the idea of fitting ONE (fairly) linear process to another linear process is iffy at best. It's NOT proof of causation. Bet I'll concede that Greenland ice loss HAS raised sea levels and they would REMAIN RAISED even if Greenland doubled in ice next decade.


Both continent specific ice ages of today, Greenland and Antarctica, grow ice on top every year. That is what ice cores capture, the climate data from every year.

Every year a new ice core layer is manufactured, and every year the fraud says that is "melting."
 
Greenland has gained ice for the past 800k years, because 800k years ago it had no ice except for mountain tops.

Search for

Ancient Greenland green

The fault at the center of the North Atlantic is slanted SW to NE, and expansion of that fault, the fault that created the Atlantic Ocean, is pushing Europe SE and Greenland NW.

When Greenland got to within about 600 miles from the North Pole, the annual snowfall ceased to fully melt during the summer, and the ice started to stack. That is how (continent specific) ice ages begin. The Vikings were farming on the southern tip until 1400s, when the ice age pushed them out.

On the other side during the past 800k years was North America, tectonically moving SW, melting from the continent specific North American ice age.

So we can now assert the following...


During the past million years, Greenland froze while North America thawed, all at the same time on the same planet with the same atmosphere with the same amount of co2 in the atmosphere


Can crick explain how co2 melted NA and froze Greenland at the same time?

Did all the atmospheric co2 clump over NA and flee Greenland???
 
Others are challenging your interpretation of this data ... can you explain the physics behind these graphs? ...

Let's use a 12.5 µm photon ... and let's strike a CO2 molecule with this photon ... what happens? ...
Are you referring to the global temperature graphs back several pages? If so, I have to ask what interpretation of those data you think I am making? And if you're referring to the graphs of Greenland ice melt over time, I have to ask what interpretation of those data you think I am making.
 
Are you referring to the global temperature graphs back several pages? If so, I have to ask what interpretation of those data you think I am making? And if you're referring to the graphs of Greenland ice melt over time, I have to ask what interpretation of those data you think I am making.
that they are worthy of anything.
 

Forum List

Back
Top