More record temps

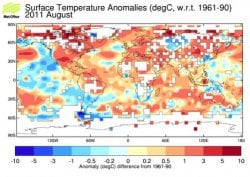
LOL. In other words, you were caught again. And, since the temps worldwide have been going up for 150 years, and rather rapidly in the last 30 years, you have no real reply. Look at that map. We are in the second La Nina this year. Yet the map has the measles. Just a few minor areas cooler than the norm.

Walleyes, once again you have been proven full of shit. Sure, it's going to get cooler. You have been stating that since you started posting. But it has continued warming in spite of a low TSI and some very strong La Ninas. As a prophet, you had better keep your day job.


Well, you know, considering the LITTLE ICE AGE ENDED 150 years ago I would EXPECT the global temperatures to GO UP you half wit. My gosh do you have ANY education?

As far as your contention about the supposed increase in warming there is only corrupted data to support your contention, on the other hand we have three years running now where the winter temps have been dropping and additionally now the summers are getting shorter and things are dying of cold in the beginning stages of the Fall season.

The only person more full of shit than me is you MENSA boy!
 
...Noaa is the half way point between hadley center and Giss and UAH in my opinion.:eusa_whistle:...

Your experience is different than mine, ...are you sure you are not conflating HAD-CRU with the NOAA datasets?

Had-CRU typically runs at the midpoint between GISS and UAH and excludes most of the polar regions. NOAA generally includes both Arctic and Antarctic data.
The merged land air and sea surface temperature anomaly analysis is based on data from the Global Historical Climatology Network (GHCN) of land temperatures and the International Comprehensive Ocean-Atmosphere Data Set (ICOADS) of Sea Surface Temperature (SST) data. Temperature anomalies with respect to 1961-1990 are analyzed separately. The analyzed monthly temperature anomalies are then merged to form the global analysis. More dataset information can be found at NCDC's Global Surface Temperature Anomaly webpage. This is the dataset NOAA uses for global temperature monitoring.
NOAA merged land air and sea surface temperature dataset

There are 5 sources of global temperature data which are most often referred to in climate research. Three of them are estimates of surface temperature, from NASA GISS (Goddard Institute for Space Studies), HadCRU (Hadley Centre/Climate Research Unit in the U.K.), and NCDC (National Climate Data Center). The other two are estimates of lower-troposphere temperature, from RSS (Remote Sensing Systems) and UAH (Univ. of Alabama at Huntsville).

The NCDC contains Arctic and Antarctic station data, as far as I can tell.
Historical Arctic and Antarctic Surface Observational Data


Not in the way giss and UAH includes them...That is why I said noaa excludes at least 20 percent of the arctic and 80 percent of Antarctica...It doesn't smooth the anomaly across both as the giss and doesn't have anywhere near the ability to see them as uah. I didn't say the noaa didn't have NO data from those area's, but they don't try to have total coverage as the giss and UAH(yes it does miss a little of both).

Seriously there are maybe 3-4 stations on the noaa map within the arctic and most of the coverage is on the coast of Antarctic, with maybe one or two over that huge continent. I'd take a satellite like Uah that has most of the view of such over it and back the giss smoothing up with it.
 
Last edited:
...I'd take a satellite like Uah that has most of the view of such over it and back the giss smoothing up with it.

I'll have to research a bit about the NCDC networks but your information sounds incorrect with regards to their Arctic and Antarctic stations and data,..as to the UAH, its data is also included in NOAA analyses, the primary problem is that it indirectly measures air mass data rather than actual surface temperatures. The UAH satellite temperature dataset attempts to infer the temperature of the atmosphere at various levels from satellite measurements of radiance.


Historical Arctic and Antarctic Surface Observational Data
Data are from 105 automatic weather stations in Iceland and Greenland, and 137 stations in Antarctica.

Historical Arctic and Antarctic Surface Observational Data

The arctic stations are limited to Greenland and Iceland, but the Antarctic stations seem well distributed. It is important to understand that NOAA, however uses an integrated dataset that does include several satellite surface temp sets of data.

NCDC: Global Surface Temperature Anomalies
 
75481128.png


Holy crap, NINA all the way to May in 2012. Another nina year. :eek:
 
Here is what the ipcc said for the next two decades

A temperature rise of about 0.1 °C per decade would be expected for the next two decades, even if greenhouse gas and aerosol concentrations were kept at year 2000 levels.
A temperature rise of about 0.2 °C per decade is projected for the next two decades for all SRES scenarios.

IPCC Fourth Assessment Report - Wikipedia, the free encyclopedia
 
temp.records.083111.jpg


What is a record? Well a record is what is considered within the historic time frame to be the highest or lowest temperature to have occurred on a day.


If you have a record that goes back to 1880...This is 130 years; to be honest to have a increase of warm over cold records shows that the area of intense heat on earth has to have expanded to a point that the cold area's only make cold record for this summer within the USA by 1 out of every 11th record. Look at the "satellite" graphic I've posted on some threads and you will understand that the area of much warmer then the means is much larger then the much colder then means. A record is the extreme, so you need just that to grow in size and scope to the point that it covers more reporting stations to make more records in that directions(record HIGHS and RECORD MAXIMUM LOWS).

Like, I've noted earlier...If you have a area of 15,000,000 sq miles of above avg and 2,000,000 sq miles what do you think is going to produce the majority of records?:lol: Well, of course records are the extreme, but the area of 15,000,000 sq miles will produce much more records.

When you're dealing with intense heat like that sat over the midwest and east this summer lets just say that you're going to get records. If you have the majority of the area of +4 to +12c with a bulls eye over Texas you'll get more records with that then a area over the west coast of -2 to -3c anomaly's. First of all you're looking for record highs and record maximum minimums within the extreme heat area's and record minimum maximums(highs) within the cold area's...There wasn't that many record lows on the other hand...Some, but not many.
 
Last edited:
I dont know if temperatures are normally distributed or not but if they are it is a well know characteristic that small changes in the average compute to large differences in the tails. someone less mathematically challenged than me could probably take the change in temps over the last 100 years (in standard deviation units) and work out what the probabilities are for the ratio of hot/cold records. guesstimating I think a one SD increase of temp would relate to a 6x increase of area at the +2SD area of the curve, 15x for 3SD. of course it depends on the specific qualities of the curve, which I dont know.
 
Ok, this is from 1990-2011...I started it before the massive vei 6 volcano in 1990...Remember, 1999-2005 was a warm enso pattern, but 2006-2011 are mostly cold...So with this stuff in mind here is how it would look like.

Started in 1990 so I didn't have to include the climb out of the vei 6.
More or less trends it within the means from 1990-2011
Added a thin black line for a forecast from 2011-2015.
Last, but not least added a blue dash line to show the difference between 1990 and 2011.

I feel 1990 is a good year to start as 1992-1994 is within the basement of the giant eruption. 1993-1998 is climbing out of it. You don't choose 1998 for the same reason as it is a huge anomaly. Do you agree?
 

Attachments

  • $to 2011.png
    $to 2011.png
    3.7 KB · Views: 54
Last edited:
This one is like the one in the post above, but with many temperature data bases. I didn't start during the climb out of the huge volcano in 1992-1995, but again started in 1990. Looks pretty linear to me. Maybe a slight slow down since 2005, but that is all.

The two sided arrow is the temperature change of the means from 2000-2011.:eusa_whistle:

anomaly years DON'T mean a thing as it's the means that's important when looking at the general climate change. It is more or less a short term "weather"(Climate) pattern like the enso that lasts on the scale of months that makes for the high anomaly. All that matters is the rising of the means...That is in black.

Lastly, I go back to 1980 with the giss and what you will find is linear from 1990-2011...This graph is on the right of the ensemble of temperature graph.
 

Attachments

  • $data_compare.jpg
    $data_compare.jpg
    44.8 KB · Views: 18
  • $to 2012.png
    $to 2012.png
    3.9 KB · Views: 19
Last edited:
Hadcrut for August--->2011/08 0.458

Here is last August--->2010/08 0.485

So -.027 colder then last August...Which is not much when considering last August was only 3 months after the strong nino. By Sept/Oct of 2011 the nina really did have a big effect, but August not a big one.

I enjoy doing this and will use the tools that we do have to keep doing it.
 

Attachments

  • $anomaly.jpg
    $anomaly.jpg
    44.6 KB · Views: 19
Last edited:
Hadcrut for August--->2011/08 0.458

Here is last August--->2010/08 0.485

So -.027 colder then last August...Which is not much when considering last August was only 3 months after the strong nino. By Sept/Oct of 2011 the nina really did have a big effect, but August not a big one.

I enjoy doing this and will use the tools that we do have to keep doing it.

Phew! There's an awful lot of RED area on that map.

Just look at Texax!

over 10 degrees higher than "normal".

Guess WAY HOT is the new normal for our chums in the Lone Star State.
 
.29c for Sept, which is 5th for UAH.

1998
2005
2009
2010

This is easily the coldest nina years overall since the 1999-2001 event to, which never had a nina below -1.5c within 3.4...So you'll have to go into the 1974-1976 event to find raw power of this nina string.
 
Last edited:

Forum List

Back
Top