IcebergSlim
Diamond Member
- Oct 11, 2013
- 10,886
- 9,142
- 2,255
- Banned
- #761
Markle,You are a moron...
A) Consider that ANY 4 consecutive quarters !make a year.
B) There was no "record spending". Federal spending grew at its lowest rate in 60 years.
C) GDP growth under Obama was 25% higher, on average, than under his predecessor...... For whom I figure you cast two enthusiastic votes.
A: Wow, brilliant and you got one right. FOUR CONSECUTIVE QUARTERS MAKE A YEAR! Impressive!
B: Really, I'm curious how you can in any way, shape or form, say that spending more in eight years, than the previous 230 COMBINED, can be described in a way you try to make good, the RATE. Goofy!
C: As for the GDP, here are the figures. Read and weep.

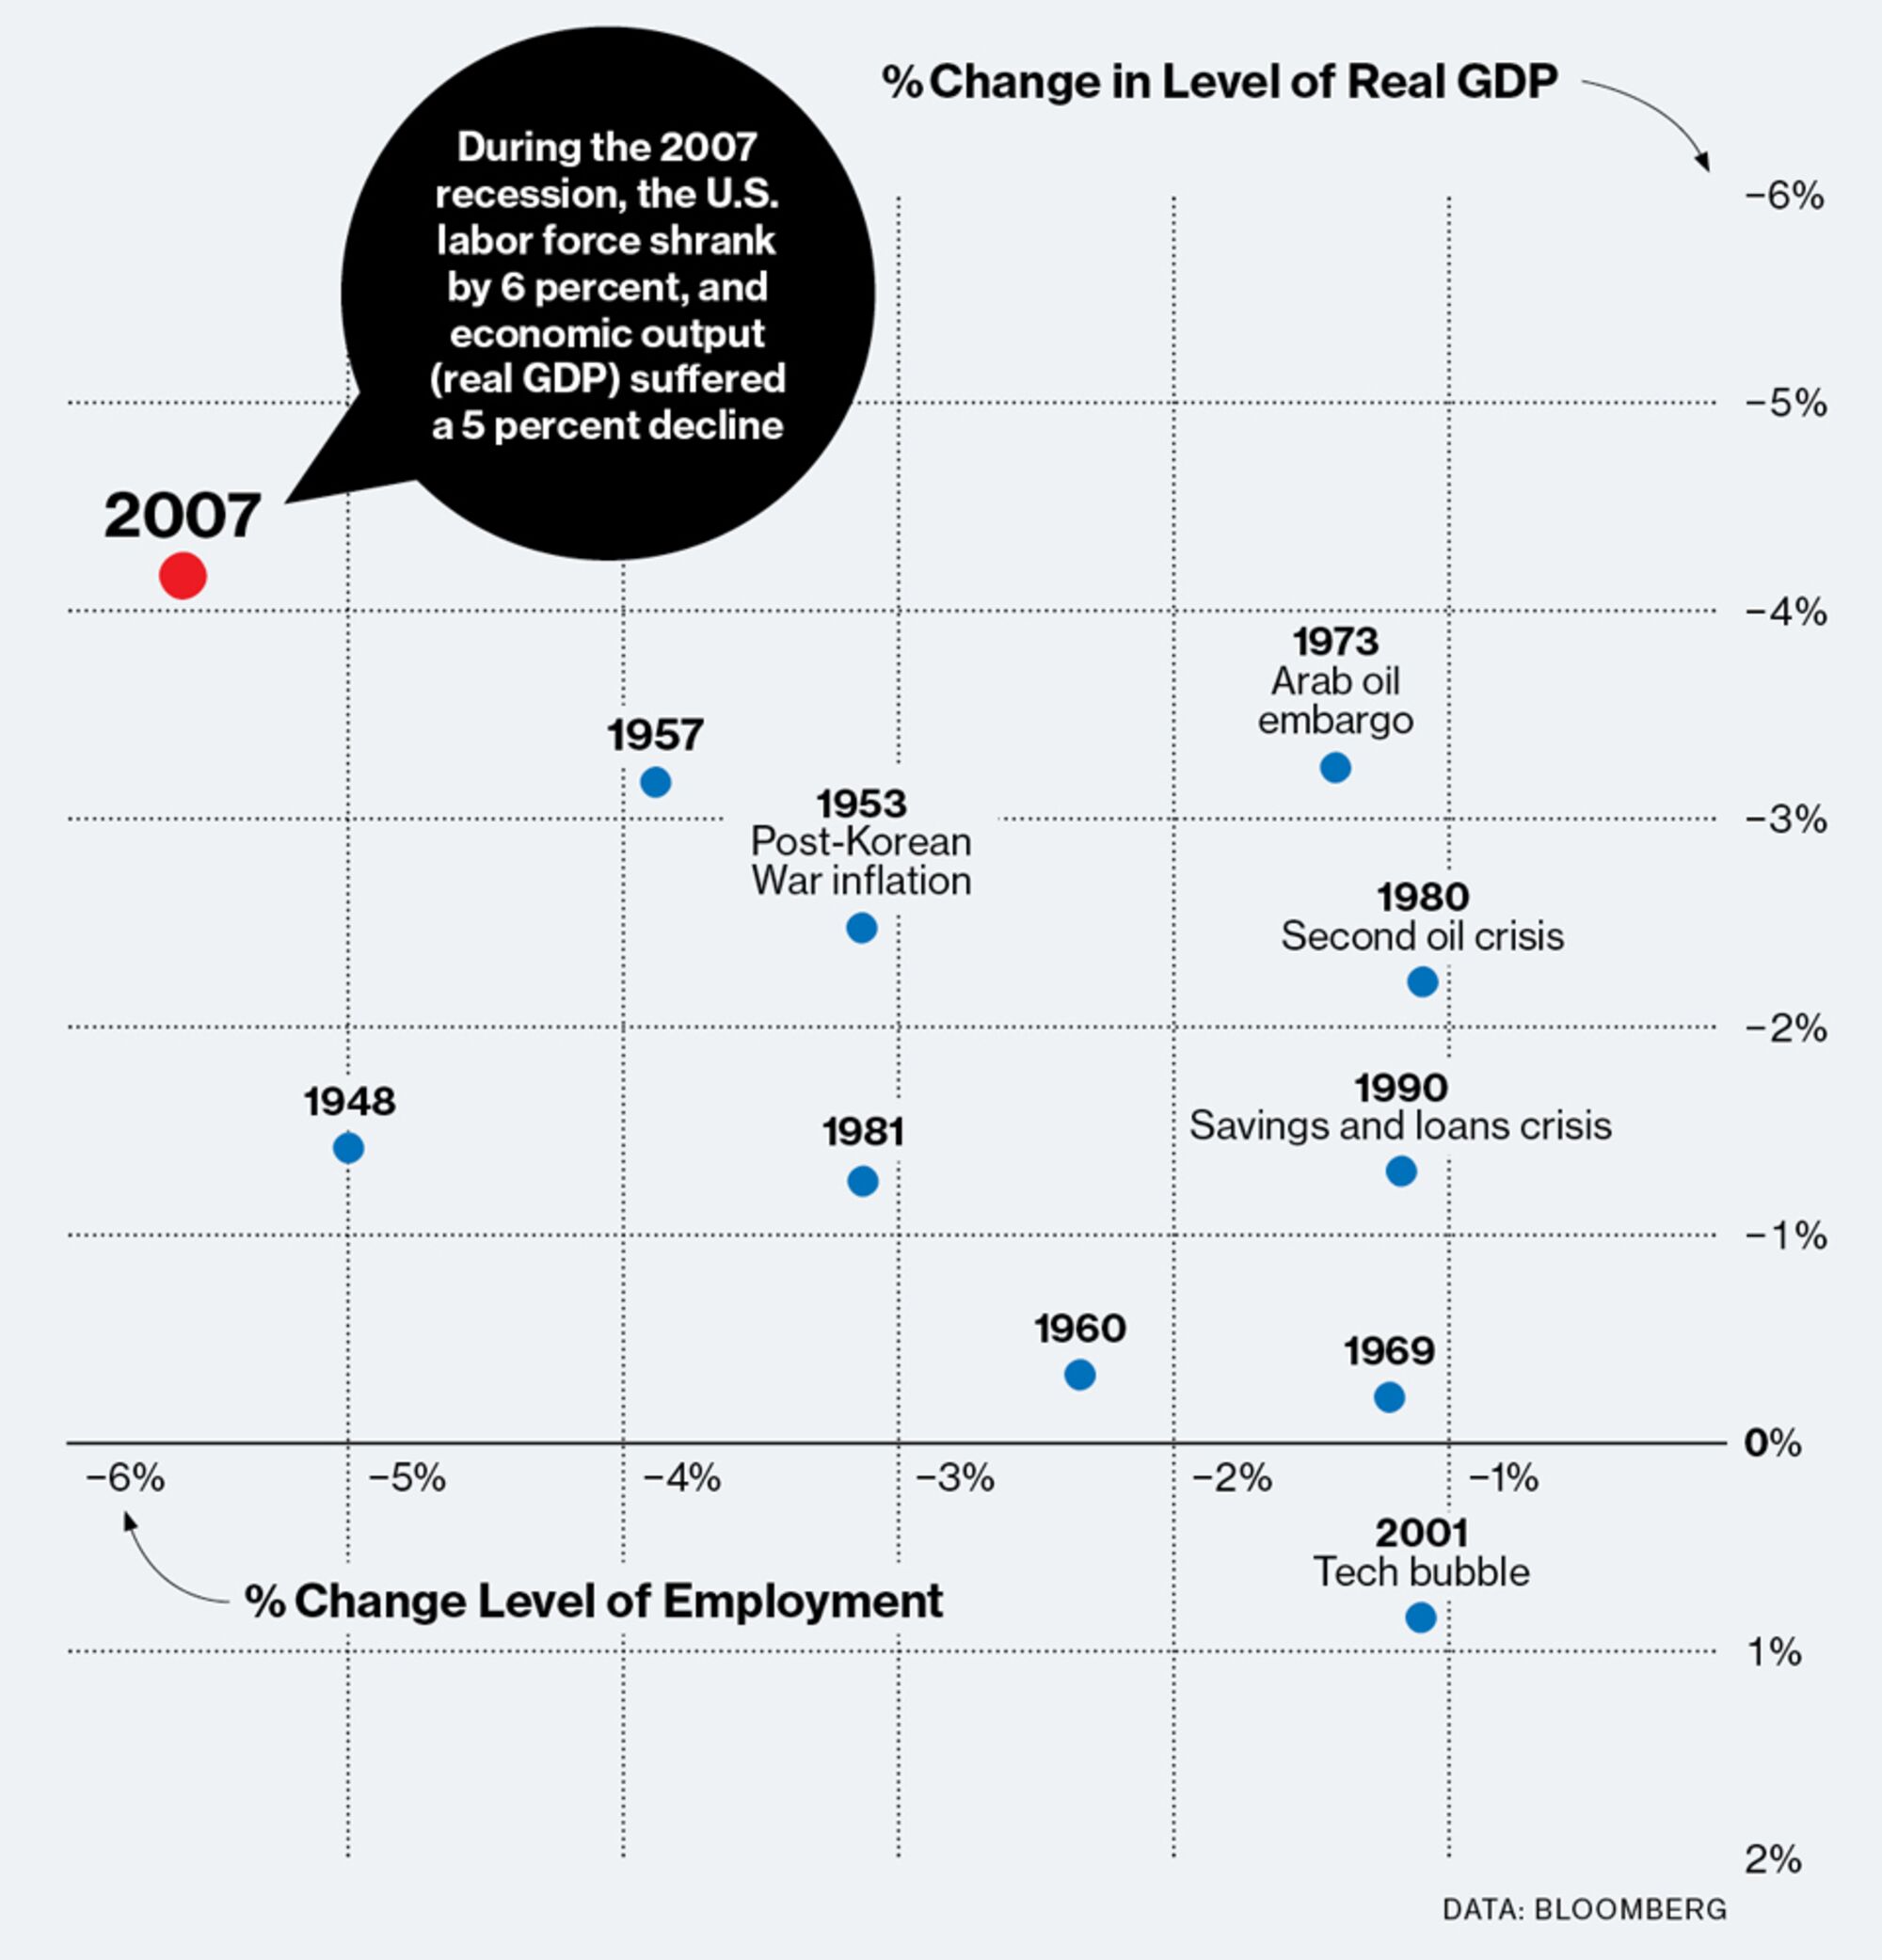
The Strange Ups and Downs of the U.S. Economy Since 1929
You are citing yourself?
Seriously....you are a moron...
For example, Scrub passes on The Great Recession to his successor......with GDP growth of NEGATIVE 5.4% in q1 2009......roughly 2.3 million jobs are lost in that quarter alone.....continuing the miserable streak begun in Nov 2007. But you cut things off at the calendar year.
Here is the link to the quarterly Real GDP
Real Gross Domestic Product
To calculate the annualized growth rate, you will need a start date, end date, two amounts, and a TVM calculator....
Do you have any idea what that is?
Here...this one is free, and pretty much Idiot Proof...
Online TVM Calculator | Financial Calculator
Start Date
2001-01-01 12643283
End Date (1) /Start Date (2)
2009-01-01 14375018
End Date (2)
2017-01-01 16842362
Growth Rate (1) - 1.6
Growth Rate (2) - 1.8
This is BEFORE we adjust for discretionary fiscal policy effect......
Ya follah?