Navigation
Install the app
How to install the app on iOS
Follow along with the video below to see how to install our site as a web app on your home screen.
Note: This feature may not be available in some browsers.
More options
You are using an out of date browser. It may not display this or other websites correctly.
You should upgrade or use an alternative browser.
You should upgrade or use an alternative browser.
Trump Economy creates 263,000 jobs in April, unemployment falls to 3.6%
- Thread starter The Purge
- Start date

AntonToo
Diamond Member
- Jun 13, 2016
- 31,369
- 9,196
- 1,340
You must be in your 20's or 30's thinking you have it all figured out.Not sure who you're talking to when you say "retard", anton.By the way, unemployment is down to 3.6%Have they? By how much?
One dollar? 10 Trillion? There is no way to know wtf we are talking about here without some sort of volume estimate.
263,000 new jobs, inflation is at .9%, and wages up 3%.
Have a good day, anton.
....ok retard, that does not AT ALL answer the question.
How different would these numbers be without Trump policies?
We had 2.9% GDP growth in 2015 just as we had in 2018, to listen to you thats not possible without Trump.
Let me ask you....how can this not be Trump's economy when he got rid of the Obama regulations?
Think about it before you answer.
Also, you might want to look at 'Real GDP' growth. It's more accurate than GDP growth.
Let me help you with that.
Real GDP growth, anton
Dec 31, 2018 2.97%.......Trump
Dec 31, 2017 2.47%.......Trump
Dec 31, 2016 1.88%.......Obama
Dec 31, 2015 2.00%.......Obama
Please don't get all emotional and call me names when you get done looking at those numbers.
...please stop opening your mouth, you have NO IDEA what you are saying or why.
These are the annual basis REAL GDP growth numbers
And you still have not at all answered anything I said, because you obviously have trouble understanding the difference between mere correlations and what it takes to even begin to establish macroeconomic causations.
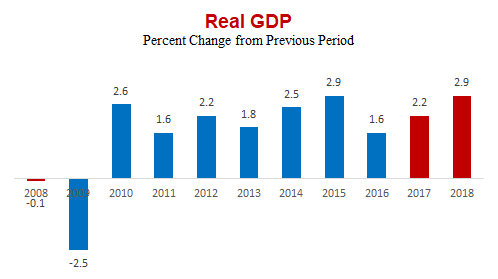
US Real GDP Growth Rate by Year
Dec 31, 2018 2.97%
Dec 31, 2017 2.47%
Dec 31, 2016 1.88%
Dec 31, 2015 2.00%
Dec 31, 2014 2.70%
Dec 31, 2013 2.61%
Dec 31, 2012 1.47%
Dec 31, 2011 1.61%
Dec 31, 2010 2.57%
Dec 31, 2009 0.18%
I'll go with an economic source over your political source any day...especially Fact Check.
Please note the 2% rate in 2015 and then the 1.88% in 2016, showing a weakening economy
under the pressures from Obama's regulations.
Now.....for you sonny....Go Pound Sand!
You fucking Idiot, the numbers are from BEA just like your numbers. However I’m using the standard ANNUAL basis, while you are using a non-standard period comparison.
AntonToo
Diamond Member
- Jun 13, 2016
- 31,369
- 9,196
- 1,340
Trump's first full 8 quarters are 50% better than Obama's....Yes economy is doing good so far with Trump, but it has done well under Obama...Obama's 2.9% in 2015 was followed Q1-16 growth of 1.6%....We had 2.9% GDP growth in 2015 just as we had in 2018, to listen to you thats not possible without Trump.By the way, unemployment is down to 3.6%Have they? By how much?
One dollar? 10 Trillion? There is no way to know wtf we are talking about here without some sort of volume estimate.
263,000 new jobs, inflation is at .9%, and wages up 3%.
Have a good day, anton.
Trump's 2.9% growth in 2018 was followed by Q1-19 growth of 3.2% which is twice as good. Your question is easy enough to answer, but the first question you need to answer is:
"WHAT IS THE PURPOSE OF THE US ECONOMY?"
Once you know that answer you will understand why Trump continues to enjoy such amazing economic success with nearly inflation free growth rates, fifty percent higher than Obama's.
Despite 50% higher GDP growth rates and several interest rate hikes by the Fed, Trump has run up LESS debt than Obama did over the same time period at the end of Obama's presidency....by the way, that was without a 1.5Trillion dollar tax-cutting stimulus and what shaping up to be trillion dollar deficits...
Trump has been President for 833 days and the Federal debt has increased by
$2,080,195,217,284.10 during that time.
Over Obama's final 833 days, he ran the debt up $2,088,824,525,722.20. So Trump is better on this measure in nominal terms and significantly better on an inflation adjusted basis.
Moron that’s not how you calculate debt, it gets posted in bulk and you can have a huge increase in very short period of time that is not representative of the average rate for the year.
Our deficits are significantly up for 2018 and 2019, with tax cuts contributing around $250B deficit to date.
And no moron we do not have “50%” more GDP growth, we have same growth we already saw in 2014-2015 period that you fools called DISASTER!
antontoo wrote:Trump's first full 8 quarters are 50% better than Obama's....Yes economy is doing good so far with Trump, but it has done well under Obama...Obama's 2.9% in 2015 was followed Q1-16 growth of 1.6%....We had 2.9% GDP growth in 2015 just as we had in 2018, to listen to you thats not possible without Trump.By the way, unemployment is down to 3.6%
263,000 new jobs, inflation is at .9%, and wages up 3%.
Have a good day, anton.
Trump's 2.9% growth in 2018 was followed by Q1-19 growth of 3.2% which is twice as good. Your question is easy enough to answer, but the first question you need to answer is:
"WHAT IS THE PURPOSE OF THE US ECONOMY?"
Once you know that answer you will understand why Trump continues to enjoy such amazing economic success with nearly inflation free growth rates, fifty percent higher than Obama's.
Despite 50% higher GDP growth rates and several interest rate hikes by the Fed, Trump has run up LESS debt than Obama did over the same time period at the end of Obama's presidency....by the way, that was without a 1.5Trillion dollar tax-cutting stimulus and what shaping up to be trillion dollar deficits...
Trump has been President for 833 days and the Federal debt has increased by
$2,080,195,217,284.10 during that time.
Over Obama's final 833 days, he ran the debt up $2,088,824,525,722.20. So Trump is better on this measure in nominal terms and significantly better on an inflation adjusted basis.
833 days is his ENTIRE Presidency and he has run up LESS debt in his entire presidency than Obama did in his time as President, of the same length, and near to the same period on the calendar as possible....you can have a huge increase in very short period of time that is not representative of the average...
Debt to the Penny (Daily History Search Application)
We most certainly do....we do not have “50%” more GDP growth ...
Obama's last 8 full quarters averaged 1.94%.
4th 16 1.8
3rd 16 1.9
2nd 16 2.3
1st 16 1.5
4th 15 0.4
3rd 15 1
2nd 15 3.3
1st 15 3.3
Trump's first 8 full quarters averaged 2.91%
1st 19 3.2
4th 18 2.2
3rd 18 3.4
2nd 18 4.2
1st 18 2.2
4th 17 2.3
3rd 17 2.8
2nd 17 3
Trump's growth rate is 50% better than Obama's "new normal.".
The facts speak for themselves, Trump is simply much better at this than Obama was. Don't be sad about this. You were satisfied with Obama's growth and Trump's is 50% better. Be happy for your fellow Americans.
Last edited:
Very nice. With unemployment this low, this probably means that people are still re-entering.
Wage growth, very nice.
Nice, nice, nice.
.
What the heck are you talking about? You claim to be an expert...and you call that report ‘nice, nice, nice’?
Weekly earnings were down (due to less hours worked). And the hourly earnings were only up a pathetic 6 cents (not even a 1/4 of 1% by my quick math).
Plus, the Household Survey showed a LOSS of employed (103,000 people). How can you praise the unemployment rate on one hand and then COMPLETELY ignore the survey numbers it is based on?
Employment Situation Summary Table B. Establishment data, seasonally adjusted
Employment Situation Summary Table A. Household data, seasonally adjusted
And the Establishment Survey job number (with it’s silly Birth/Death Model) is a semi-joke.
If you are SUCH an ‘expert’...you should be aware of all of the above. Yet you seem blissfully unaware of any bad news in the report.
No offense intended...just sayin’.
I just have to ask, Have you no shame? And, Do you think people are so dumb that they will not easily see how dishonestly selective you are being?
You cherry-pick a tiny handful of stats that are more than offset by other--more important--stats, and then you act like the April jobs numbers are bad. Just absurd.
Wages? Up?
Jobs? 263,000 new jobs.
Female unemployment? All-time low.
Black and Hispanic unemployment? All-time lows.
Unemployment rate? The lowest in 50 YEARS.
The U-6? The lowest in well over a decade.
But, no, you ignore all this and focus on weekly hours and loss of employment. Did your eyes just miss the part where the report said that "Over the month, the number of unemployed persons decreased by 387,000 to 5.8 million"? Did you get that? The number of UNemployed people DEcreased by 387,000.
rightwinger
Award Winning USMB Paid Messageboard Poster
- Aug 4, 2009
- 284,672
- 156,204
- 2,615
LOLTrump's first full 8 quarters are 50% better than Obama's....Yes economy is doing good so far with Trump, but it has done well under Obama...Obama's 2.9% in 2015 was followed Q1-16 growth of 1.6%....We had 2.9% GDP growth in 2015 just as we had in 2018, to listen to you thats not possible without Trump.By the way, unemployment is down to 3.6%Have they? By how much?
One dollar? 10 Trillion? There is no way to know wtf we are talking about here without some sort of volume estimate.
263,000 new jobs, inflation is at .9%, and wages up 3%.
Have a good day, anton.
Trump's 2.9% growth in 2018 was followed by Q1-19 growth of 3.2% which is twice as good. Your question is easy enough to answer, but the first question you need to answer is:
"WHAT IS THE PURPOSE OF THE US ECONOMY?"
Once you know that answer you will understand why Trump continues to enjoy such amazing economic success with nearly inflation free growth rates, fifty percent higher than Obama's.
Despite 50% higher GDP growth rates and several interest rate hikes by the Fed, Trump has run up LESS debt than Obama did over the same time period at the end of Obama's presidency....by the way, that was without a 1.5Trillion dollar tax-cutting stimulus and what shaping up to be trillion dollar deficits...
Trump has been President for 833 days and the Federal debt has increased by
$2,080,195,217,284.10 during that time.
Over Obama's final 833 days, he ran the debt up $2,088,824,525,722.20. So Trump is better on this measure in nominal terms and significantly better on an inflation adjusted basis.
Debt to the Penny (Daily History Search Application)
The differences between Obama's failed approach and Trump's successful approach will become clear as soon as you figure out the answer to this question:
"WHAT IS THE PURPOSE OF THE US ECONOMY?"
Cherry Pick much?
Compare Trumps first eight quarters to Obama’s?
Want to compare the economy Obama was given vs the economy Trump was given?
2,080, 195, 217,284 debt for Trump
2,088, 824,525,722 debt for Obama
Nearly identical yet you call Obama’s debt significantly better
AntonToo
Diamond Member
- Jun 13, 2016
- 31,369
- 9,196
- 1,340
Very nice. With unemployment this low, this probably means that people are still re-entering.
Wage growth, very nice.
Nice, nice, nice.
.
What the heck are you talking about? You claim to be an expert...and you call that report ‘nice, nice, nice’?
Weekly earnings were down (due to less hours worked). And the hourly earnings were only up a pathetic 6 cents (not even a 1/4 of 1% by my quick math).
Plus, the Household Survey showed a LOSS of employed (103,000 people). How can you praise the unemployment rate on one hand and then COMPLETELY ignore the survey numbers it is based on?
Employment Situation Summary Table B. Establishment data, seasonally adjusted
Employment Situation Summary Table A. Household data, seasonally adjusted
And the Establishment Survey job number (with it’s silly Birth/Death Model) is a semi-joke.
If you are SUCH an ‘expert’...you should be aware of all of the above. Yet you seem blissfully unaware of any bad news in the report.
No offense intended...just sayin’.
I just have to ask, Have you no shame? And, Do you think people are so dumb that they will not easily see how dishonestly selective you are being?
You cherry-pick a tiny handful of stats that are more than offset by other--more important--stats, and then you act like the April jobs numbers are bad. Just absurd.
Wages? Up?
Jobs? 263,000 new jobs.
Female unemployment? All-time low.
Black and Hispanic unemployment? All-time lows.
Unemployment rate? The lowest in 50 YEARS.
The U-6? The lowest in well over a decade.
But, no, you ignore all this and focus on weekly hours and loss of employment. Did your eyes just miss the part where the report said that "Over the month, the number of unemployed persons decreased by 387,000 to 5.8 million"? Did you get that? The number of UNemployed people DEcreased by 387,000.
Yes silly, when you have solid job growth for 8 years straight at some point you'll have low unemployment.
Unemployment went down from 10% in 2010 to 4.8% before Obama left offiice (aka STAGNATION!), it then went down another 1.2% under Trump (aka BOOM!)
Mac1958
Diamond Member
That's the way it works now.Very nice. With unemployment this low, this probably means that people are still re-entering.
Wage growth, very nice.
Nice, nice, nice.
.
What the heck are you talking about? You claim to be an expert...and you call that report ‘nice, nice, nice’?
Weekly earnings were down (due to less hours worked). And the hourly earnings were only up a pathetic 6 cents (not even a 1/4 of 1% by my quick math).
Plus, the Household Survey showed a LOSS of employed (103,000 people). How can you praise the unemployment rate on one hand and then COMPLETELY ignore the survey numbers it is based on?
Employment Situation Summary Table B. Establishment data, seasonally adjusted
Employment Situation Summary Table A. Household data, seasonally adjusted
And the Establishment Survey job number (with it’s silly Birth/Death Model) is a semi-joke.
If you are SUCH an ‘expert’...you should be aware of all of the above. Yet you seem blissfully unaware of any bad news in the report.
No offense intended...just sayin’.
I just have to ask, Have you no shame? And, Do you think people are so dumb that they will not easily see how dishonestly selective you are being?
You cherry-pick a tiny handful of stats that are more than offset by other--more important--stats, and then you act like the April jobs numbers are bad. Just absurd.
Wages? Up?
Jobs? 263,000 new jobs.
Female unemployment? All-time low.
Black and Hispanic unemployment? All-time lows.
Unemployment rate? The lowest in 50 YEARS.
The U-6? The lowest in well over a decade.
But, no, you ignore all this and focus on weekly hours and loss of employment. Did your eyes just miss the part where the report said that "Over the month, the number of unemployed persons decreased by 387,000 to 5.8 million"? Did you get that? The number of UNemployed people DEcreased by 387,000.
Economic data is virtually always mixed, and today is no different. Those who are hoping for the worst will always ignore the good and focus on the bad.
That must be a horrible way to go through life. No wonder so many people are so nasty.
.
Moonglow
Diamond Member
I still refuse to get a job...
rightwinger
Award Winning USMB Paid Messageboard Poster
- Aug 4, 2009
- 284,672
- 156,204
- 2,615
Me tooI still refuse to get a job...
Deplorable Yankee
Diamond Member
The man is a fucking business GENIUS....Eat your heart out Surrender Monkey and ABNORMAL HATERS!
The economy generated a stronger than expected 263,000 new jobs in April, helping to drive down the unemployment rate to a 49-year low of 3.6%. The increase in new jobs easily topped the 217,000 MarketWatch forecast. The jobless rate slid from 3.8% in March to hit the lowest level since December 1969. The average wage paid to American workers rose 6 cents, or 0.2%, to $27.77 an hour. The 12-month rate of hourly wage gains was unchanged at 3.2%. Hours worked each week fell 0.1 hour in April to 34.4. The government revised the increase in new jobs in March to 189,000 from a preliminary 196,000. February's gain was raised to 56,000 from 33,000.
U.S. creates 263,000 jobs in April, unemployment falls to 3.6%
ZZZ presidents don't really make the economy .they can only pretty much discourage or encourage in many different ways...derp from confidence factors to policy for regs
to taxes and im not repeating it again
trump
confidence shot up after the night he was elected .

obama did ber de dur de dur be derp
WAH WAH WAH WAH
gdp this gdp that collusion collusion collusion fer de der capitalist criminals blah blah wah wha
drop dead cockroaches
go merica!
rightwinger
Award Winning USMB Paid Messageboard Poster
- Aug 4, 2009
- 284,672
- 156,204
- 2,615
LOLView attachment 259324Me tooI still refuse to get a job...
Even Rasmussen can only get him to 50% in an economy with 3.6 percent unemployment
Jitss617
Diamond Member
- Jan 2, 2019
- 39,095
- 9,330
- 1,340
- Banned
- #234
Trump can’t force the media to be responsible .. its when cnn is crashing lolLOLView attachment 259324Me tooI still refuse to get a job...
Even Rasmussen can only get him to 50% in an economy with 3.6 percent unemployment
Bullshit, you buffoon. Mine was annual. I linked my source, you link yours.You must be in your 20's or 30's thinking you have it all figured out.Not sure who you're talking to when you say "retard", anton.By the way, unemployment is down to 3.6%
263,000 new jobs, inflation is at .9%, and wages up 3%.
Have a good day, anton.
....ok retard, that does not AT ALL answer the question.
How different would these numbers be without Trump policies?
We had 2.9% GDP growth in 2015 just as we had in 2018, to listen to you thats not possible without Trump.
Let me ask you....how can this not be Trump's economy when he got rid of the Obama regulations?
Think about it before you answer.
Also, you might want to look at 'Real GDP' growth. It's more accurate than GDP growth.
Let me help you with that.
Real GDP growth, anton
Dec 31, 2018 2.97%.......Trump
Dec 31, 2017 2.47%.......Trump
Dec 31, 2016 1.88%.......Obama
Dec 31, 2015 2.00%.......Obama
Please don't get all emotional and call me names when you get done looking at those numbers.
...please stop opening your mouth, you have NO IDEA what you are saying or why.
These are the annual basis REAL GDP growth numbers
And you still have not at all answered anything I said, because you obviously have trouble understanding the difference between mere correlations and what it takes to even begin to establish macroeconomic causations.
US Real GDP Growth Rate by Year
Dec 31, 2018 2.97%
Dec 31, 2017 2.47%
Dec 31, 2016 1.88%
Dec 31, 2015 2.00%
Dec 31, 2014 2.70%
Dec 31, 2013 2.61%
Dec 31, 2012 1.47%
Dec 31, 2011 1.61%
Dec 31, 2010 2.57%
Dec 31, 2009 0.18%
I'll go with an economic source over your political source any day...especially Fact Check.
Please note the 2% rate in 2015 and then the 1.88% in 2016, showing a weakening economy
under the pressures from Obama's regulations.
Now.....for you sonny....Go Pound Sand!
You fucking Idiot, the numbers are from BEA just like your numbers. However I’m using the standard ANNUAL basis, while you are using a non-standard period comparison.
Not only were his economic recovery numbers anemic, he also had the fed reserve
lending rate at nearly 0% his entire time in office. Which was historic, and he couldn't kick start
a strong economy given that. Hell, that had to be embarrassing.
Last edited:
rightwinger
Award Winning USMB Paid Messageboard Poster
- Aug 4, 2009
- 284,672
- 156,204
- 2,615
Trump can’t force the media to be responsible .. its when cnn is crashing lolLOLView attachment 259324Me tooI still refuse to get a job...
Even Rasmussen can only get him to 50% in an economy with 3.6 percent unemployment
Trump can act more responsible
A President with 3.6 percent unemployment should easily be over 60 percent approval
Trumps behavior is bringing him down
Moonglow
Diamond Member
That and high gas prices along with wrecking the healthcare system.Trump can’t force the media to be responsible .. its when cnn is crashing lolLOLView attachment 259324Me tooI still refuse to get a job...
Even Rasmussen can only get him to 50% in an economy with 3.6 percent unemployment
Trump can act more responsible
A President with 3.6 percent unemployment should easily be over 60 percent approval
Trumps behavior is bringing him down
Not in this environment he can't...nobody can.Trump can’t force the media to be responsible .. its when cnn is crashing lolLOLView attachment 259324Me tooI still refuse to get a job...
Even Rasmussen can only get him to 50% in an economy with 3.6 percent unemployment
Trump can act more responsible
A President with 3.6 percent unemployment should easily be over 60 percent approval
Trumps behavior is bringing him down
Obama only had a job approval number over 50 once and that was in 2009.
Jitss617
Diamond Member
- Jan 2, 2019
- 39,095
- 9,330
- 1,340
- Banned
- #239
Lol more responsible? He is he doing the job he said he would do. And is being attacked by opportunist media, they are mad he won and are trying to coup him through the media.. won’t happen and the polls are wrong.. we see time after time pollsters are asking 55% dems 44% republicans. It’s a joke trump is the true representation of what a real American looks like .. assimilate, learn, then democrats might one day win an electionTrump can’t force the media to be responsible .. its when cnn is crashing lolLOLView attachment 259324Me tooI still refuse to get a job...
Even Rasmussen can only get him to 50% in an economy with 3.6 percent unemployment
Trump can act more responsible
A President with 3.6 percent unemployment should easily be over 60 percent approval
Trumps behavior is bringing him down
How is Trump responsible for high gas prices Moonglow?That and high gas prices along with wrecking the healthcare system.Trump can’t force the media to be responsible .. its when cnn is crashing lolLOL
Even Rasmussen can only get him to 50% in an economy with 3.6 percent unemployment
Trump can act more responsible
A President with 3.6 percent unemployment should easily be over 60 percent approval
Trumps behavior is bringing him down
Similar threads
- Replies
- 9
- Views
- 195
- Replies
- 69
- Views
- 2K
- Replies
- 9
- Views
- 124
- Replies
- 37
- Views
- 1K
Latest Discussions
- Replies
- 18
- Views
- 84
- Replies
- 50
- Views
- 261
- Replies
- 173
- Views
- 2K
Forum List
-
-
-
-
-
Political Satire 8420
-
-
-
-
-
-
-
-
-
-
-
-
-
-
-
-
-
-
-
ObamaCare 781
-
-
-
-
-
-
-
-
-
-
-
Member Usernotes 478
-
-
-
-
-
-
-
-
-
-