3.7 GDP Growth

Dummy you are showing calendar year growth numbers and using that metric Trump posted mediocre 2.6% for 2017.

Listen little boy. I've already determined from what I saw you post a little while ago, that if you were a kid in my former economics class, you'd be out the door, and sent to go study cookie baking. So if you think you have a prayer of joining up with these laughingstock, lefty scam boys, and getting away with distorting the numbers/facts, you're very deluded.

Try reading the whole thread. I've posted growth numbers for a whole variety of time periods, all throughout this thread, of which calendar years is just one of. Now go back to your video game, and stop pretending that you know something.
 
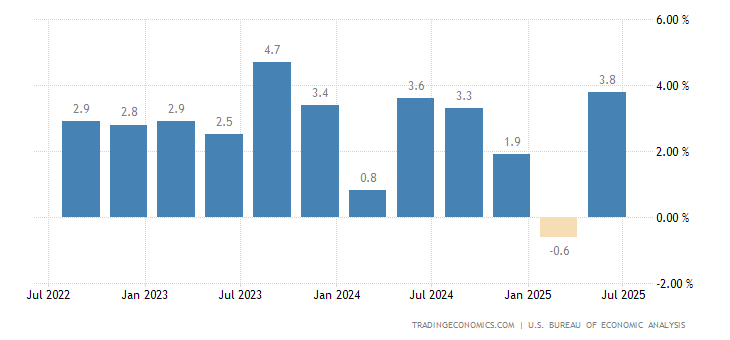
united-states-gdp-growth-annual.png
united-states-gdp-growth.png
 
Dummy you are showing calendar year growth numbers and using that metric Trump posted mediocre 2.6% for 2017.

Listen little boy. I've already determined from what I saw you post a little while ago, that if you were a kid in my former economics class, you'd be out the door, and sent to go study cookie baking. So if you think you have a prayer of joining up with these laughingstock, lefty scam boys, and getting away with distorting the numbers/facts, you're very deluded.

Try reading the whole thread. I've posted growth numbers for a whole variety of time periods, all throughout this thread, of which calendar years is just one of. Now go back to your video game, and stop pretending that you know something.
protectionist has been corrected competently.

His manipulation of the graphs are false.

He is ad homming.
 
protectionist knows what the graphs mean but reads them differently so he can troll his opponents.

The fact is that Trump's economy is not better than Trump's in GDP and other measures.

Call him for what he is.
1. No, I don't read anything differently that anyone else. The graphs show what they show.

2. You said >> "Trump's economy is not better than Trump's in GDP and other measures."

Is there a doctor in the house ? I mean really.
 
protectionist has been corrected competently.

His manipulation of the graphs are false.

He is ad homming.
"Manipulation" of graphs ? HA HA HA. Wow. For your edification, I'm not a really computer savvy guy, and LOL, I wouldn't know how to manipulate a graph if my life depended on it. Lefties getting incredibly desperate these days. First the Russain collusion BS, and now this. Shame on you.

No, I just copy pasted them from TradingEconomics.com, and this is what they are, and unlike some of the goofy things you all posted, mine are in complete agreement with each other, all show the same numbers (regardless of time periods), whereas yours are all over the map. Mine are also BEA signed, so you have no crab about that.

Oh wow. it's 1;25 PM, and I'm missing Gunsmoke, just for this sillieness. See ya.
 
Here is your source with annual smoothing, below is the exact same source with the exact same data period without the smoothing. Notice how the quarterly graph without the annual smoothing is jagged at each quarterly point and the graph with the annual smoothing is rounded.
historical.png
 
The nation is at Full Employment and folks are bringing home more of their paychecks. Trump's delivering. Obviously Democrats hate that, but it is the reality.
 
The nation was at full employment in Jan 2017. The tax breaks elapse for Joe Citizen soon. Clap quick while you can Dschrute3.
 
Why do you keep switching between annual and quarterly figures?

You post annual figures only up through 2016 — when someone posts your same figures but up through current figures, you switch to quarterly figures.

Then when someone posts quarterly figures under Obama, you switch back to annual figures.

Do you really think others here are as stupid as you to not see the bullshit you’re pulling?
 
LOLOL

Now you're switching between annualized growth and quarterly growth.

Obama had 8 quarters over 3% ...

2009Q4 3.9
2010Q2 3.9
2011Q4 4.6
2013Q3 3.1
2013Q4 4.0
2014Q2 4.6
2014Q3 5.2
2015Q1 3.2

But annualized, which you pointed out how Obama peaked at 3.8%, has been no higher than 2.9% under Trump. And again, that figure began growing under Obama and the trend continued under Trump.

Annualized:
2016Q2 1.2
2016Q3 1.5
2016Q4 1.9
2017Q1 2.0
2017Q2 2.2
2017Q3 2.3
2017Q4 2.6
2018Q1 2.9

And my signature is just as true as always, no matter how much it irritates you.
I already refuted all that (with large numbers and colors) Ho hum. Hee hee. :biggrin:
 
Now wait just a minute there Slick, Faun is using YOUR annual graph for her numbers, not the quarterly graph you have now shifted to for a convenient deception.

Here is the same graph with the running annual numbers at the top.

united-states-gdp-growth-annual.png
I already refuted that graph. (about 10 times) Ho hum. :biggrin:
 
The nation is at Full Employment and folks are bringing home more of their paychecks. Trump's delivering. Obviously Democrats hate that, but it is the reality.
We’ve been at full employment for years now. What took you so long to figure it out?
 
The nation is at Full Employment and folks are bringing home more of their paychecks. Trump's delivering. Obviously Democrats hate that, but it is the reality.
We’ve been at full employment for years now. What took you so long to figure it out?

3.9% Unemployment. Lowest in 17.5 years. Trump is delivering. Sorry bout that. ;)
 
Now wait just a minute there Slick, Faun is using YOUR annual graph for her numbers, not the quarterly graph you have now shifted to for a convenient deception.

Here is the same graph with the running annual numbers at the top.

united-states-gdp-growth-annual.png
I already refuted that graph. (about 10 times) Ho hum. :biggrin:
LOLOL

Then you refuted yourself since he posted your own chart at you.
 
The nation is at Full Employment and folks are bringing home more of their paychecks. Trump's delivering. Obviously Democrats hate that, but it is the reality.
We’ve been at full employment for years now. What took you so long to figure it out?

3.9% Unemployment. Lowest in 17.5 years. Trump is delivering. Sorry bout that. ;)
Sorry about what? That the trends under a obama have continued so far under Trump?
 
And like the dishonest lying scum POS you are, you have deliberately switched to the QUARTERLY graph.
Here is the full quarterly graph from the EXACT SAME source with the EXACT SAME sig showing Q3 2014 at 5.2%

united-states-gdp-growth.png
I already refuted this graph. I guess I'll have to keep doing it all day. All week ? All Month ? All year ? :iyfyus.jpg:

united-states-gdp-growth-annual.png
 

Forum List

Back
Top