Evidence supporting AGW

The level of shrillness? The only thing I've put up here so far is extracts from Wikipedia articles. You're the ones with all the personal insults.
Once again the conversation goes right over your head. Your response does bolster my point though. ...thanks.

The total denier input into this thread consists of nothing but insults and unsupported opinion. My input has consisted entirely of discussions of peer reviewed scientific studies. Where do you see "shrillness and desperation" in my posts?

Asshole.

And yet not one link to any datasets with source code that proves your religion.
 
And yet not one link to any datasets with source code that proves your religion.
I have already provided you with links to numerous climate datasets and source code to numerous GCMs. This statement of yours is a

BALD-FACED LIE
 
Last edited:
Where's the lab work?

If the facts are on your side, pound the facts into the table. If the law is on your side, pound the law into the table. If neither the facts nor the law are on your side, tell them you have computer models and CONSENSUS and call them DENIERS!!!! -- paraphrasing Dershowitz
 
Here you go Koosh

and Frank, do go fuck yourself.


And yet not one link to datasets with source code that proves CO2 drives climate. Notice that zero scientific evidence exists to support the AGW religion.

You lying sack of shit. I posted both publicly available datasets and publicly available code for well-known GCMs.

**************************************************************
waaaaaaaaaaaaaaaaaaaaaaaaa!!
why wont people believe me!!

Because you really are that stupid.

Climate datasets

General Circulation models code
 
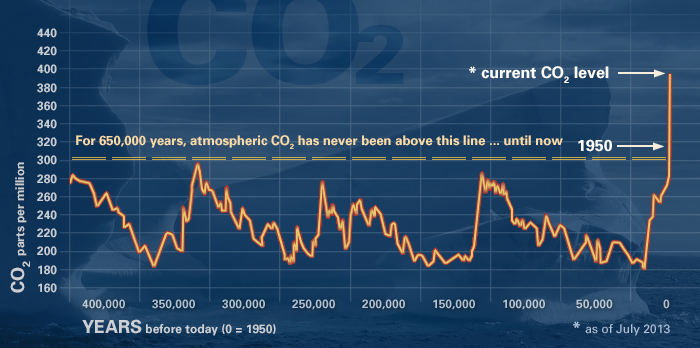
Current CO2 levels are unprecedented in many hundreds of thousands of years - certainly in all of human history.

Evidence_CO2.jpg
 
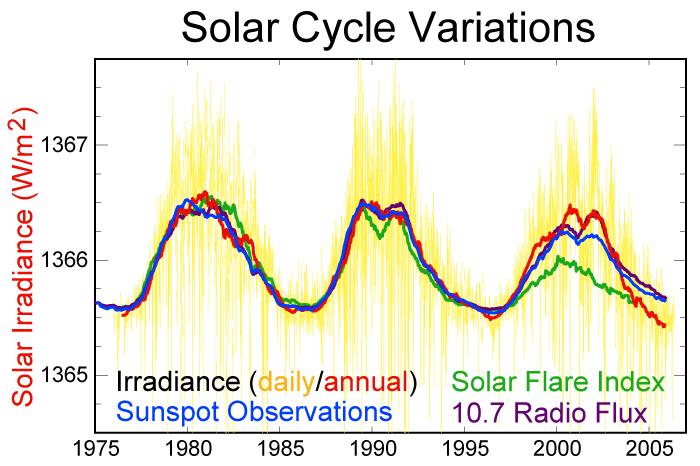
Change in TSI has been wholly inadequate as a cause for the observed warming.

Solar-cycle-data.png
 
The planet's ice is disappearing. And with it, our albedo is getting less and less - we will absorb more and more and more solar energy.

Glacier_Mass_Balance.png
 
According to the United States National Research Council,

[T]here is a strong, credible body of evidence, based on multiple lines of research, documenting that climate is changing and that these changes are in large part caused by human activities. While much remains to be learned, the core phenomenon, scientific questions, and hypotheses have been examined thoroughly and have stood firm in the face of serious scientific debate and careful evaluation of alternative explanations. * * * Some scientific conclusions or theories have been so thoroughly examined and tested, and supported by so many independent observations and results, that their likelihood of subsequently being found to be wrong is vanishingly small. Such conclusions and theories are then regarded as settled facts. This is the case for the conclusions that the Earth system is warming and that much of this warming is very likely due to human activities.[49]
 
Last edited:
Claims that current temperatures were commonplace during the Holocene are simply not supported by the evidence.

Holocene_Temperature_Variations.png
 
https://en.wikipedia.org/wiki/Global_warming_controversy

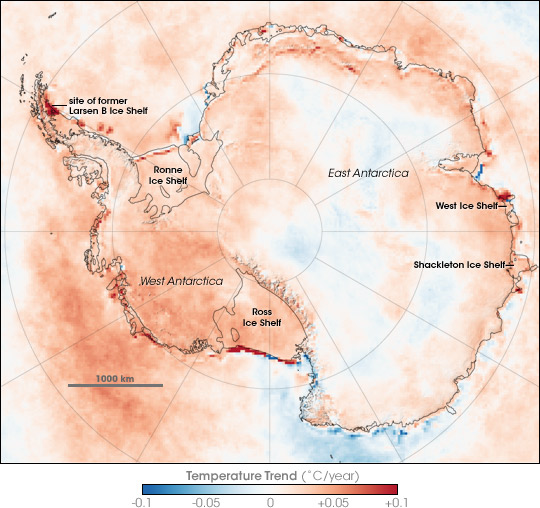
Antarctica cooling
Main article: Antarctica cooling controversy

Antarctic_Temperature_Trend_1981-2007.jpg

Antarctic Skin (the roughly top millimeter of land, sea, snow, or ice) Temperature Trends between 1981 and 2007, based on thermal infrared observations made by a series of NOAA satellite sensors; note that they do not necessarily reflect air temperature trends.

There has been a public dispute regarding the apparent contradiction in the observed behavior of Antarctica, as opposed to the global rise in temperatures measured elsewhere in the world. This became part of the public debate in the global warming controversy, particularly between advocacy groups of both sides in the public arena, as well as the popular media.

In contrast to the popular press, there is no evidence of a corresponding controversy in the scientific community. Observations unambiguously show the Antarctic Peninsula to be warming. The trends elsewhere show both warming and cooling but are smaller and dependent on season and the timespan over which the trend is computed. A study released in 2009, combined historical weather station data with satellite measurements to deduce past temperatures over large regions of the continent, and these temperatures indicate an overall warming trend. One of the paper's authors stated "We now see warming is taking place on all seven of the earth’s continents in accord with what models predict as a response to greenhouse gases." According to 2011 paper by Ding, et al., "The Pacific sector of Antarctica, including both the Antarctic Peninsula and continental West Antarctica, has experienced substantial warming in the past 30 years."
 
Last edited:
20Solar-EarthTemp_sm.jpg


While the correlation between atmospheric increases in CO2 and earth's temperatures is poor (r2=0.44), it is much better for solar irradiance and solar activity (r2=>70 -- The higher the rs value the greater the correlation). It has long been known that solar irradiance by itself does not provide enough energy to cause the warming on earth experienced in the twentieth century. However, when combined with the type of solar irradiance that is emitted during high periods of solar activity every 11 and 22 years (the solar cycle), there is a poorly understood, but good correlation. Solar flares, coronal mass ejections and other solar activity reach a maximum during the peak of each solar cycle and somehow influence ocean temperatures and therefore climate. One of the leading theories on this interaction is the interaction between solar activity and incoming cosmic radiation on cloud formation, explained below.

11CosmicRadiation-Cloudiness_lg.jpg


Research done primarily at the Danish National Space Center has show there is a very high correlation between incoming solar radiation and cloud formation. Cosmic radiation originates from exploding super novae. When the cosmic radiation enter the earth's atmosphere, they excite water vapor molecules, causing them to clump together (condense) into tiny water droplets which form low elevation clouds. These clouds then reflect the solar radiation back into space instead of warming the earth. This causes the earth to cool. When the sun becomes more active more solar flares, coronal mass ejections and other solar activity dramatically increase the solar winds which push back cosmic radiation thereby preventing the cosmic radiation from reaching the earth's atmosphere and creating more clouds. Since there is less cloud formation, more solar radiation reaches the earth's surface and the earth warms. It is estimated that this phenomenon can account for 85 percent of the warming that occurred in the twentieth century.
 
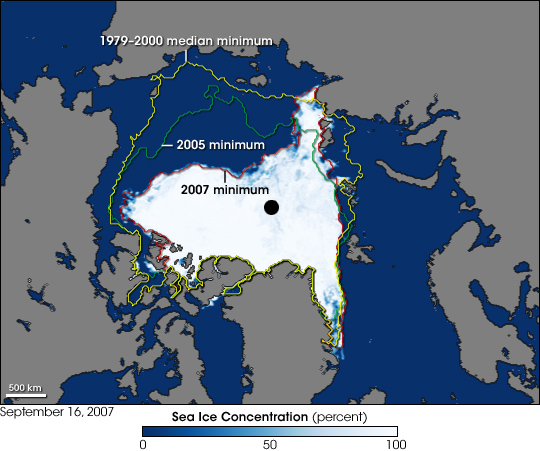
Somebody come get all excited about that 60% increase in Arctic ice extents! Please!

2007_Arctic_Sea_Ice.jpg
 
Still the AGW religion does not hold up when you use real science.

No matter how much the AGW cult tries to post and prove their religion using fake data and made up charts based on the AGW religious scribes.

The true deniers of science are the AGW cult and this thread (as well as all their posts) prove that!
 
Cooling-Antarctica_lg.jpg


Although global warming models show that both polar regions should warming with CO2-caused global warming, the various stations maintained in Antarctica show Antarctica to be cooling over the past two decades. One research paper in 2008 allegedly showing Antarctica to be warming is being accepted with skepticism by the scientific community, even by those who still maintain that global warming is caused by human activity. The main criticism centers on the use of highly questionable equations to fill in temperature data between the widely scattered weather stations in Antarctica. It appears to many to be a repeat of the infamous hockey stick curve fiasco of the early 2000s.
The only place Antarctica has shown true warming is along Western Antarctica and the Antarctic Peninsula. This is where pictures of massive ice chucks breaking off of Antarctica come from that are shown on the news every couple of years. Research published in 2007-2008 found that this warming is NOT do to global warming, but to volcanic activity under the ocean and ice flows.
 
10TempPast11000Yrs_lg.jpg


It is often reported that the temperature of the earth is higher the past 20 years than it has ever been in history. This is simply not true, nor has it ever been. Hundreds of research studies using ice cores, pollen sedimentation, tree rings, etc. have shown that there were dozens of periods in the past 11,000 years (generally called the Holocene period) that earth's temperature was significantly warmer than it is today. Earth's temperature was very much warmer at least four times during the current interglacial period. The polar bears did just fine during those warmer periods.
 
5-450000yrTemp-CO2_lg.jpg


The Intergovernmental Panel on Climate Change (IPCC) and Al Gore's video Inconvenient Truth both separate earth's long term global CO2 and temperature to give the appearance that there is a high correlation between CO2 and Temperature over the past 450,000 to 650,000 years. By doing so, it leads to the conclusion that CO2 changes have historically caused temperature changes. What is not obvious, however, until the graphs are superimposed is that temperature changes always precedes CO2 changes, indicating that temperature causes CO2 to change. As the earth warms, the oceans gradually warm. Warm water holds less carbon dioxide, so the carbon dioxide dissolved in the ocean diffuses into the atmosphere. It takes hundreds of years for this to happen. That is why there is a lag of 600 to 1200 years before atmospheric carbon dioxide responds to earth's warming. The reverse is true when earth cools. Gradually the oceans cool, and the atmospheric carbon dioxide dissolves back into the ocean.
 
6-TempPrecedesCO2_lg.jpg


Rather than changes in earth's CO2 causing temperature to change, scientists have actually found that changes in earth's temperatures always precedes changes in CO2 by 400 to a 1000 years -- just the opposite of what global warming proponents would have us believe.
 
Arctic Sea Ice News and Analysis | Sea ice data updated daily with one-day lag

Northern Hemisphere Snow Cover Retreats Rapidly

After a greater-than-average snow extent in February, snow extent over the Northern Hemisphere shrank rapidly in March, April and May. The Rutgers University Global Snow Lab measured the lowest April snow extent in Eurasia in the 48-year data record. In May, snow rapidly retreated in the central Canadian Provinces in North America, and Central Asia (Kazakhstan and northwestern China), where extensive areas had above-average snow cover in February.

Snow cover in central Europe and the desert southwest of the United States were persistently below average throughout the winter and spring of 2013 to 2014. In the United States, this underscores the severe drought in the far southwest and Sierra Nevada. The rapid late spring loss in the Northern Hemisphere continues a decade-long trend toward very low snow cover early in the Arctic sea ice melt season. This resulted in warmer air over darker snow-free areas, which leads to warm air advection over the sea ice

in regions where the snow cover is anomalously low, and dry conditions in the northern boreal forests. These conditions cause increased wildfire activity and soot deposition on the sea ice and the Greenland Ice Sheet surface. High concentrations of soot on the Greenland snow pack and sea ice can contribute to ice retreat and melt.

Figure4b.png

Sorry since this is not "Global" it can not be used as evidence based on the posting from the AGW religious nuts like yourself.
 

Forum List

Back
Top