Evidence supporting AGW

Total Glacier Volume is Shrinking

glacial-decrease.gif

Cumulative decline (in cubic miles) in glacier ice worldwide. More information: Global Climate Change Impacts in the U.S.

Warming temperatures lead to the melting of glaciers and ice sheets. The total volume of glaciers on Earth is declining sharply. Glaciers have been retreating worldwide for at least the last century; the rate of retreat has increased in the past decade. Only a few glaciers are actually advancing (in locations that were well below freezing, and where increased precipitation has outpaced melting). The progressive disappearance of glaciers has implications not only for a rising global sea level, but also for water s
 
GLOBAL CLIMATE CHANGE INDICATORS

How do we know humans are the primary cause of the warming?
A large body of evidence supports the conclusion that human activity is the primary driver of recent warming. This evidence has accumulated over several decades, and from hundreds of studies. The first line of evidence is our basic physical understanding of how greenhouse gases trap heat, how the climate system responds to increases in greenhouse gases, and how other human and natural factors influence climate. The second line of evidence is from indirect estimates of climate changes over the last 1,000 to 2,000 years. These estimates are often obtained from living things and their remains (like tree rings and corals) which provide a natural archive of climate variations. These indicators show that the recent temperature rise is clearly unusual in at least the last 1,000 years. The third line of evidence is based on comparisons of actual climate with computer models of how we expect climate to behave under certain human influences. For example, when climate models are run with historical increases in greenhouse gases, they show gradual warming of the Earth and ocean surface, increases in ocean heat content, a rise in global sea level, and general retreat of sea ice and snow cover. These and other aspects of modeled climate change are in agreement with observations.

Climate Model Indications and the Observed Climate

human-and-natural-influences.gif

Simulated global temperature in experiments that include human influences (pink line), and model experiments that included only natural factors (blue line). The black line is observed temperature change.

Global climate models clearly show the effect of human-induced changes on global temperatures. The blue band shows how global temperatures would have changed due to natural forces only (without human influence). The pink band shows model projections of the effects of human and natural forces combined. The black line shows actual observed global average temperatures. The close match between the black line and the pink band indicates that observed warming over the last half-century cannot be explained by natural factors alone, and is instead caused primarily by human factors.

800,000 Year Record of Carbon Dioxide (CO2) Concentrations

800k-year-co2-concentration.gif

Carbon dioxide concentration (parts per million) for the last 800,000 years, measured from trapped bubbles of air in an Antarctic ice core. The 2008 observed value is from the Mauna Loa Observatory in Hawaii and projections are based upon future emission scenarios. More information on the data can be found in the Climate Change Impacts on the U.S. report.

Over the last 800,000 years, natural factors have caused the atmospheric carbon dioxide (CO2) concentration to vary within a range of about 170 to 300 parts per million (ppm). The concentration of CO2 in the atmosphere has increased by roughly 35 percent since the start of the industrial revolution. Globally, over the past several decades, about 80 percent of human-induced CO2 emissions came from the burning of fossil fuels, while about 20 percent resulted from deforestation and associated agricultural practices. In the absence of strong control measures, emissions projected for this century would result in the CO2 concentration increasing to a level that is roughly 2 to 3 times the highest level occurring over the glacial-interglacial era that spans the last 800,000 or more years.

Energy from the Sun Has Not Increased

solar-variability.gif

Global surface temperature (top, blue) and the Sun's energy received at the top of Earth's atmosphere (red, bottom). Solar energy has been measured by satellites since 1978

The amount of solar energy received at the top of our atmosphere has followed its natural 11-year cycle of small ups and downs, but with no net increase. Over the same period, global temperature has risen markedly. This indicates that it is extremely unlikely that solar influence has been a significant driver of global temperature change over several decades.
 
Total Glacier Volume is Shrinking

glacial-decrease.gif

Cumulative decline (in cubic miles) in glacier ice worldwide. More information: Global Climate Change Impacts in the U.S.

Warming temperatures lead to the melting of glaciers and ice sheets. The total volume of glaciers on Earth is declining sharply. Glaciers have been retreating worldwide for at least the last century; the rate of retreat has increased in the past decade. Only a few glaciers are actually advancing (in locations that were well below freezing, and where increased precipitation has outpaced melting). The progressive disappearance of glaciers has implications not only for a rising global sea level, but also for water s


Funny thing...they are finding all sorts of remains of forests and ancient human debris as these glaciers shrink showing that it is nothing new and certainly nothing to worry about...unless you are a gibbering hysteric of course.
 
"Likewise, if we were to double preindustrial levels of CO2, we would expect the surface and the lower atmosphere to warm. However, unlike the case of increasing solar influence, we would not expect the lower atmosphere to warm through at all levels. Increasing the greenhouse effect should warm the surface and troposphere, but cool the lower stratosphere."

LOL!

Really?!

Yes, really.

But you expect the deep Pacific Ocean to eat the Warming?

LOL

You're so gullible!

Note the boldened text in your quote from the article. The surface gets warmed by greenhouse effect heating. Alterations in tropical wind patterns which rather dramatically affected ENSO cycle timing, subducted the warmed surface waters created by the dramatic rise in temperatures between 1980 and 2000.

Three different studies have now found precisely this effect. Why do you think believing this makes me gullible? It sounds more as if you have absolutely nothing to say on this topic.
 
Funny thing...they are finding all sorts of remains of forests and ancient human debris as these glaciers shrink showing that it is nothing new and certainly nothing to worry about...unless you are a gibbering hysteric of course.

Please give us some detail here. What do you think is indicated by these finds?

And did you really want to suggest that you're a "gibbering hysteric"?
 
Last edited:
Funny thing...they are finding all sorts of remains of forests and ancient human debris as these glaciers shrink showing that it is nothing new and certainly nothing to worry about...unless you are a gibbering hysteric of course.

Please give us some detail here. What do you think is indicated by these finds?

What I know, based on these finds is that not so very long ago, those glaciers didn't exist...They probably were little more than ice fields during the Roman warm period. Then the ice came and life got tough for humans....cold is always worse than warm.
 
Arctic Sea Ice News and Analysis | Sea ice data updated daily with one-day lag

Northern Hemisphere Snow Cover Retreats Rapidly

After a greater-than-average snow extent in February, snow extent over the Northern Hemisphere shrank rapidly in March, April and May. The Rutgers University Global Snow Lab measured the lowest April snow extent in Eurasia in the 48-year data record. In May, snow rapidly retreated in the central Canadian Provinces in North America, and Central Asia (Kazakhstan and northwestern China), where extensive areas had above-average snow cover in February.

Snow cover in central Europe and the desert southwest of the United States were persistently below average throughout the winter and spring of 2013 to 2014. In the United States, this underscores the severe drought in the far southwest and Sierra Nevada. The rapid late spring loss in the Northern Hemisphere continues a decade-long trend toward very low snow cover early in the Arctic sea ice melt season. This resulted in warmer air over darker snow-free areas, which leads to warm air advection over the sea ice

in regions where the snow cover is anomalously low, and dry conditions in the northern boreal forests. These conditions cause increased wildfire activity and soot deposition on the sea ice and the Greenland Ice Sheet surface. High concentrations of soot on the Greenland snow pack and sea ice can contribute to ice retreat and melt.

Figure4b.png

Sorry since this is not "Global" it can not be used as evidence based on the posting from the AGW religious nuts like yourself.

WRONG

My data is LABELED "Northern Hemisphere". That's what they call "honesty". Your Vostok core data were labeled :"Earth's Temperature". That's what they call "a lie".

Yes we know the Vostock Ice Cores are DENIERS!!! because they show your God lagging temperature on the increase and decrease
 
Climate model, climate model, climate model, climate model. Ever notice how you science deniers always confuse climate models with actual data?

Have you further noticed that when the actual data refutes your models you falsify the data to support your models?

And you claim to understand science:lol::lol::lol:[/QUOTE

]I gotta ask. The article says, in one sentence so this should be easymfor you, "When uncertainties in models and observations are properly accounted for, newer observational data sets"....

I bolded the key words so you can more readily identify them.

So, whatnis confusing you about models and observations?
 
Detection vs Attribution

Detection and attribution of climate signals, as well as its common-sense meaning, has a more precise definition within the climate change literature, as expressed by the IPCC.[17]

Detection of a signal requires demonstrating that an observed change is statistically significantly different from that which can be explained by natural internal variability.

Attribution requires demonstrating that a signal is:

unlikely to be due entirely to internal variability;
consistent with the estimated responses to the given combination of anthropogenic and natural forcing
not consistent with alternative, physically plausible explanations of recent climate change that exclude important elements of the given combination of forcings.

Detection does not imply attribution, and is easier to show than attribution. Unequivocal attribution would require controlled experiments with multiple copies of the climate system, which is not possible. Therefore, attribution, as described above, can only be done within some margin of error. For example, the IPCC's Fourth Assessment Report says "it is extremely likely that human activities have exerted a substantial net warming influence on climate since 1750," where "extremely likely" indicates a probability greater than 95%.[1]

So.....you have no proof. tsk, tsk, and yet you believe in mumbo jumbo when the data doesn't support the liars. Now that is denying.

That is an epic fail!

You are confused. That statement clearly says that clearly states the methodoligy by which it was proven.

Perhaps you don't understand how things are proven. For that matter, learn.
 
"Likewise, if we were to double preindustrial levels of CO2, we would expect the surface and the lower atmosphere to warm. However, unlike the case of increasing solar influence, we would not expect the lower atmosphere to warm through at all levels. Increasing the greenhouse effect should warm the surface and troposphere, but cool the lower stratosphere."

LOL!

Really?!

Yes, really.

But you expect the deep Pacific Ocean to eat the Warming?

LOL

You're so gullible!

Note the boldened text in your quote from the article. The surface gets warmed by greenhouse effect heating. Alterations in tropical wind patterns which rather dramatically affected ENSO cycle timing, subducted the warmed surface waters created by the dramatic rise in temperatures between 1980 and 2000.

Three different studies have now found precisely this effect. Why do you think believing this makes me gullible? It sounds more as if you have absolutely nothing to say on this topic.

Yes calling a 600,000 year data set a DENIER!!!! because it fails your stupid models is a sure sign of mental stability on your part
 
Detection vs Attribution

Detection and attribution of climate signals, as well as its common-sense meaning, has a more precise definition within the climate change literature, as expressed by the IPCC.[17]

Detection of a signal requires demonstrating that an observed change is statistically significantly different from that which can be explained by natural internal variability.

Attribution requires demonstrating that a signal is:

unlikely to be due entirely to internal variability;
consistent with the estimated responses to the given combination of anthropogenic and natural forcing
not consistent with alternative, physically plausible explanations of recent climate change that exclude important elements of the given combination of forcings.

Detection does not imply attribution, and is easier to show than attribution. Unequivocal attribution would require controlled experiments with multiple copies of the climate system, which is not possible. Therefore, attribution, as described above, can only be done within some margin of error. For example, the IPCC's Fourth Assessment Report says "it is extremely likely that human activities have exerted a substantial net warming influence on climate since 1750," where "extremely likely" indicates a probability greater than 95%.[1]

So.....you have no proof. tsk, tsk, and yet you believe in mumbo jumbo when the data doesn't support the liars. Now that is denying.

That is an epic fail!

You are confused. That statement clearly says that clearly states the methodoligy by which it was proven.

Perhaps you don't understand how things are proven. For that matter, learn.

There was CONSENSUS!!! that the Earth was a Flat plane held up on the back of a Giant Turtle, and that's probably more likely to be correct than your AGW Theory
 
Yes we know the Vostock Ice Cores are DENIERS!!! because they show your God lagging temperature on the increase and decrease

Wake up Frank. Stop drinking. Stop smoking dope. Stop whacking yourself in the head with a rubber mallet. Stop doing whatever it is you're doing that's making you SO DUMB.

Your graph labeled Vostok ice core data as global data. "Earth's Temperature". That was bullshit Frank. Surely you can grasp the point there. Can't you Frank. Try real, real hard.
 
So.....you have no proof. tsk, tsk, and yet you believe in mumbo jumbo when the data doesn't support the liars. Now that is denying.

That is an epic fail!

God, you're more stupid than Frank!
 
7Temp2001-2008_lg.jpg


Earth's temperature has not risen significantly since 1998 and has cooled by 0.5oC since early 2007. Even the United Nations has quietly admitted this. This is completely contrary to the CO2 caused global warming theory, which states that the earth's temperature should be quickly rising because atmospheric CO2 is rising quickly. The UN and those who support the CO2 warming theory claim that the cooling is just a temporary glitch and earth's temperature will began to rise again in a year or two. However, as explained, a majority of scientists now believe that we are in for a 15 to 35 year cooling cycle that has nothing to do with CO2 and everything to do with solar activity and temperature oscillations of the oceans.

I'll start by addressing this statement; "" This is completely contrary to the CO2 caused global warming theory, which states that the earth's temperature should be quickly rising because atmospheric CO2 is rising quickly.

There is no such theory. This is your personal theory that come up with, apparently because you need an oversimplied theory that you can get your head arround.


So you do not have any training or knowledge of statistics. You also don't appear to understand how the basic factors of TSI, CO2, and PDO have influenced the globsl mean temperature since the 1880.

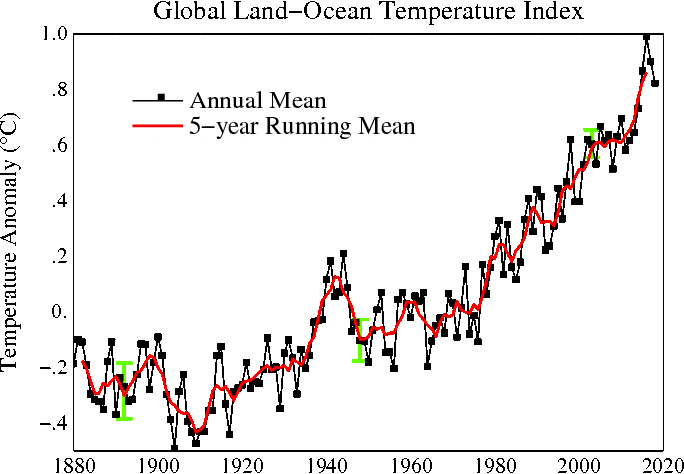
I'll explain. The chart is the global mean land ocean temperature.

Fig.A2.gif


What is notable can be divided up into a few time spans, 1880 to 1910, 1910 to 1940, 1940 to 1980, and 1980 to the present.

The time periods spaning 1880 to 1950 actually combine into one feature that was dominated by the PDO (Pacific Decadal Oscillation ). The PDO is, as it says, an oscillation. Andmthe period from 1880 through was dominated by this oscillation as it moved heat to and from the deep ocean, causing land-ocean temperatures to inrease and decrease.

Begining in about 1950, carbon emissions of CO2 began having an equal footing with the PDO. Through the period through 1980, the falling temperatures caused by the PDO moving heat into the ocean, was offset by increasing heat trapped by rising CO2 in the atmosphere.

From 1980 to about 2000, CO2 became the predominate driving and causing the steep increase in temperature seen today?

Over that entire time span solar energy has been the source of the additional heat. And much of the finer and smaller changes were by solar variation.

Throughout the entire time span, TSI, CO2 and PDO created the greater features but then change was not in a smooth line. This remaining variation is noise, small and random fluctuations. When all the variability in temperature caused by the three larger drivers has been accounted for, the remaining noise leaves a small percentage of randomly unpredictable variance. The temperature then expected to vary by some small degee from whatr the PDO, CO2, and TSI account for.

On the graph, the noise boundaries, how high and how low it can be expected, is shown by light green error bars. Starting in about 2002, the five year runnig mean shows "flatteing". This flattening is not unexpected. Then temperature still remains within the bound of expected noise
 
Last edited:
So.....you have no proof. tsk, tsk, and yet you believe in mumbo jumbo when the data doesn't support the liars. Now that is denying.

That is an epic fail!

You are confused. That statement clearly says that clearly states the methodoligy by which it was proven.

Perhaps you don't understand how things are proven. For that matter, learn.

There was CONSENSUS!!! that the Earth was a Flat plane held up on the back of a Giant Turtle, and that's probably more likely to be correct than your AGW Theory

Take your meds and go to bed. Obviously that globe on your shoulders is heating up and causing you to be incoherent.
 
I wonder how many of these warmer idiots will suicide out of sheer despair when the hoax finally comes tumbling down?

It never ends well for Death worshipong Cults, CO2 is their Jonesville and they will glady drink the KoolAid

Let's start a bet. We can put the money in trust for, say, 29 years. That will work nicely. Everyone puts in $100 a month for next 20 years. Then, when the twenty years are up, the winners divide it up.
 
Last edited:
And yet zero scientific evidence has been provided to prove the AGW religion.

Not one link to datasets with source code that proves CO2 drives climate, but the AGW faithful keep trying.

However all they do is show that real science in this area is dead.

Do tell, what will you do with this data and model?
 
Last edited:
Total Glacier Volume is Shrinking

glacial-decrease.gif

Cumulative decline (in cubic miles) in glacier ice worldwide. More information: Global Climate Change Impacts in the U.S.

Warming temperatures lead to the melting of glaciers and ice sheets. The total volume of glaciers on Earth is declining sharply. Glaciers have been retreating worldwide for at least the last century; the rate of retreat has increased in the past decade. Only a few glaciers are actually advancing (in locations that were well below freezing, and where increased precipitation has outpaced melting). The progressive disappearance of glaciers has implications not only for a rising global sea level, but also for water s

Do you have one that goes back another 15,000 years?
 
GLOBAL CLIMATE CHANGE INDICATORS

How do we know humans are the primary cause of the warming?
A large body of evidence supports the conclusion that human activity is the primary driver of recent warming. This evidence has accumulated over several decades, and from hundreds of studies. The first line of evidence is our basic physical understanding of how greenhouse gases trap heat, how the climate system responds to increases in greenhouse gases, and how other human and natural factors influence climate. The second line of evidence is from indirect estimates of climate changes over the last 1,000 to 2,000 years. These estimates are often obtained from living things and their remains (like tree rings and corals) which provide a natural archive of climate variations. These indicators show that the recent temperature rise is clearly unusual in at least the last 1,000 years. The third line of evidence is based on comparisons of actual climate with computer models of how we expect climate to behave under certain human influences. For example, when climate models are run with historical increases in greenhouse gases, they show gradual warming of the Earth and ocean surface, increases in ocean heat content, a rise in global sea level, and general retreat of sea ice and snow cover. These and other aspects of modeled climate change are in agreement with observations.

Climate Model Indications and the Observed Climate

human-and-natural-influences.gif

Simulated global temperature in experiments that include human influences (pink line), and model experiments that included only natural factors (blue line). The black line is observed temperature change.

Global climate models clearly show the effect of human-induced changes on global temperatures. The blue band shows how global temperatures would have changed due to natural forces only (without human influence). The pink band shows model projections of the effects of human and natural forces combined. The black line shows actual observed global average temperatures. The close match between the black line and the pink band indicates that observed warming over the last half-century cannot be explained by natural factors alone, and is instead caused primarily by human factors.

800,000 Year Record of Carbon Dioxide (CO2) Concentrations

800k-year-co2-concentration.gif

Carbon dioxide concentration (parts per million) for the last 800,000 years, measured from trapped bubbles of air in an Antarctic ice core. The 2008 observed value is from the Mauna Loa Observatory in Hawaii and projections are based upon future emission scenarios. More information on the data can be found in the Climate Change Impacts on the U.S. report.

Over the last 800,000 years, natural factors have caused the atmospheric carbon dioxide (CO2) concentration to vary within a range of about 170 to 300 parts per million (ppm). The concentration of CO2 in the atmosphere has increased by roughly 35 percent since the start of the industrial revolution. Globally, over the past several decades, about 80 percent of human-induced CO2 emissions came from the burning of fossil fuels, while about 20 percent resulted from deforestation and associated agricultural practices. In the absence of strong control measures, emissions projected for this century would result in the CO2 concentration increasing to a level that is roughly 2 to 3 times the highest level occurring over the glacial-interglacial era that spans the last 800,000 or more years.

Energy from the Sun Has Not Increased

solar-variability.gif

Global surface temperature (top, blue) and the Sun's energy received at the top of Earth's atmosphere (red, bottom). Solar energy has been measured by satellites since 1978

The amount of solar energy received at the top of our atmosphere has followed its natural 11-year cycle of small ups and downs, but with no net increase. Over the same period, global temperature has risen markedly. This indicates that it is extremely unlikely that solar influence has been a significant driver of global temperature change over several decades.


:lol::lol::lol::lol: Highlighted for the blind..... Once again confounding computer fiction with facts.

And of course the first assumption is wrong. they have no real idea how GHG's work. They just know what gasses are GHG's, they have no idea of the mechanism.
 

Forum List

Back
Top