Arctic sea ice BACK to Normal!

If the effects are poorly understood, it sounds as if this is a perfect alternative to the CO2 theory since this is also poorly understood.

If it was well understood, then the predictions would be accurate. They are not.


So, you're an astro physicist. Tell us what this part of the abstract means.

"Model calculations suggest that almost half of the global cloud condensation nuclei in the atmospheric boundary layer may originate from the nucleation of aerosols from trace condensable vapours4, although the sensitivity of the number of cloud condensation nuclei to changes of nucleation rate may be small5, 6. Despite extensive research, fundamental questions remain about the nucleation rate of sulphuric acid particles and the mechanisms responsible, including the roles of galactic cosmic rays and other chemical species such as ammonia7. Here we present the first results from the CLOUD experiment at CERN. We find that atmospherically relevant ammonia mixing ratios of 100 parts per trillion by volume, or less, increase the nucleation rate of sulphuric acid particles more than 100–1,000-fold."


1) It means exactly what it says.

2) It means CLOSE to the following: the role of cosmic rays in the formation of clouds is poorly understand, and here we present the first results from an experiment designed to investigate this. The addition of ammonia causes an increase in the formation of cloud seeds, and.....


Its cut off at the end because you picked a weird place to cut the abstract.


If this poorly understood, then it is the prefect alternative theory to CO2 causing warming which is also poorly understood.
Wow. You really do think you understand the paper better than its lead author. Must be hard to walk around being smarter than everyone at everything all the time.
 
I keep telling you?

"Keep telling" requires multiple tells. I posted ONCE in this thread.


I was speaking figuratively for all of the warmers who keep claiming that the Arctic ice is disappearing. All the while ignoring the fact that it is in fact increasing, and getting thicker.

How do they do that? Not tell the truth I mean.

Really? Extant increasing and getting thicker, also? Perhaps you can post some links to real scientists that are stating that?

Because here is what the real scientists are stating from actual observations.

http://arctic.atmos.uiuc.edu/cryosphere/IMAGES/seaice.area.arctic.png

Note that the high points were running 14 to 15 million square kilometers from 1979 to 1989. From 1990 to 2004, they were running mid 13 to mid 14 million square kilometers for a high. Since 2005, the high points have never reached 14 million square kilometers.

The lows were running mid 4 to mid 5 million square kilometers from 1979 to 1997. From 1998 to 2006 they ran mostly just over 4 million square kilometers, since then, they have mostly been right at 3 million square kilometers for a low. Just how the hell do you get increasing in extant out of that, Walleyes?

PIOMAS, from the University of Washington has been keeping track of ice volume.

http://psc.apl.washington.edu/wordp...olumeAnomalyCurrentV2.png?<?php echo time() ?

Now just how do you fit that in with your claim of increasing ice volume?


See that red line there?
 

Attachments

  • $ssmi1_ice_ext.jpg
    $ssmi1_ice_ext.jpg
    70.8 KB · Views: 59
the thing about most of the stuff writen by global warming alarmists is that you have to check for 'adjustments' or 'cherry picking' or 'unfounded conclusions'.

starting about 1970, satellites were being used to photograph the world in a systematic method (earlier for the military). we also had pretty good radar tracking and harbour records for ice extent.

I realise that 1979 was the beginning of measuring temperatures by satellite microwave readings but is it reasonable to start the ice extent historical record there? even though there were satellite records earlier, and pretty good observations even earlier than that? inquiring minds want to know.

was there anything special about the 70's? yes, because of the Arctic Ocillation weather patterns the ice went from a drastic low in about 1975 to an unprecedented high in 1979. interesting eh? I try not to conjure up conspiracies, and I dont think this is one, but it certainly was an auspicious place to start the record if you wanted to exaggerate the ice loss.

for those who always cry for a link you can go to figure 7.20, page 224 of the first IPCC report to see for yourselves.

http://www.ipcc.ch/ipccreports/far/wg_I/ipcc_far_wg_I_full_report.pdf

Sea-ice conditions are now reported regularly in marine
synoptic observations, as well as by special reconnaissance
flights, and coastal radar. Especially importantly, satellite
observations have been used to map sea-ice extent
routinely since the early 1970s. The American Navy Joint
Ice Center has produced weekly charts which have been
digitised by NOAA. These data are summarized in Figure
7.20 which is based on analyses carried out on a 1° latitude
x 2.5° longitude grid.
 
Last edited:
I was speaking figuratively for all of the warmers who keep claiming that the Arctic ice is disappearing. All the while ignoring the fact that it is in fact increasing, and getting thicker.

How do they do that? Not tell the truth I mean.

Really? Extant increasing and getting thicker, also? Perhaps you can post some links to real scientists that are stating that?

Because here is what the real scientists are stating from actual observations.

http://arctic.atmos.uiuc.edu/cryosphere/IMAGES/seaice.area.arctic.png

Note that the high points were running 14 to 15 million square kilometers from 1979 to 1989. From 1990 to 2004, they were running mid 13 to mid 14 million square kilometers for a high. Since 2005, the high points have never reached 14 million square kilometers.

The lows were running mid 4 to mid 5 million square kilometers from 1979 to 1997. From 1998 to 2006 they ran mostly just over 4 million square kilometers, since then, they have mostly been right at 3 million square kilometers for a low. Just how the hell do you get increasing in extant out of that, Walleyes?

PIOMAS, from the University of Washington has been keeping track of ice volume.

http://psc.apl.washington.edu/wordp...olumeAnomalyCurrentV2.png?<?php echo time() ?

Now just how do you fit that in with your claim of increasing ice volume?


See that red line there?

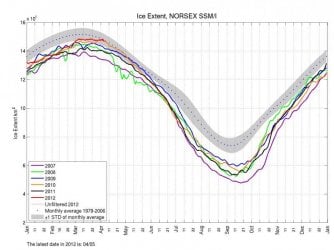
A much better view here;

http://nsidc.org/data/seaice_index/images/daily_images/N_stddev_timeseries.png

Note that it never got up to the normal high. Not only that, but now is descending faster than the mean line. The maximum extent never got to 14 million square kilometers, and is now descending rapidly.

http://arctic.atmos.uiuc.edu/cryosphere/IMAGES/seaice.area.arctic.png

So, you have failed to demonstrate any increase in extent, compared to the prior records, care to try for volume?

It looks like variations in a normal range.

One thing for sure I don't see "wider and wider swings"
 
Actual observations? Now that's funny. Try satellite images "interpreted" by people working on government contracts. Were you aware that those results are reviewed before being accepted by the government? That the "findings" are sent back for more "analysis" when they don't show what the agency wants?
 
See that red line there?

A much better view here;

http://nsidc.org/data/seaice_index/images/daily_images/N_stddev_timeseries.png

Note that it never got up to the normal high. Not only that, but now is descending faster than the mean line. The maximum extent never got to 14 million square kilometers, and is now descending rapidly.

http://arctic.atmos.uiuc.edu/cryosphere/IMAGES/seaice.area.arctic.png

So, you have failed to demonstrate any increase in extent, compared to the prior records, care to try for volume?

It looks like variations in a normal range.

One thing for sure I don't see "wider and wider swings"

Can you quantify that statement?
 
actual observations? Now that's funny. Try satellite images "interpreted" by people working on government contracts. Were you aware that those results are reviewed before being accepted by the government? That the "findings" are sent back for more "analysis" when they don't show what the agency wants?

how do you know?

One of my customers volunteered the information during conversation about a year ago. It was one of the reasons he left the company.
 
1) It means exactly what it says.

2) It means CLOSE to the following: the role of cosmic rays in the formation of clouds is poorly understand, and here we present the first results from an experiment designed to investigate this. The addition of ammonia causes an increase in the formation of cloud seeds, and.....


Its cut off at the end because you picked a weird place to cut the abstract.


If this poorly understood, then it is the prefect alternative theory to CO2 causing warming which is also poorly understood.
Wow. You really do think you understand the paper better than its lead author. Must be hard to walk around being smarter than everyone at everything all the time.


I'm not sure what you're saying. I observed that the CERN results are poorly understood. Is it your assertion that the lead author is saying that the results are completely understood?

That's not how I read the reports on this experiment.

Can you show the part of his statement in which he says that the experiment's data are all completely understood?
 
actual observations? Now that's funny. Try satellite images "interpreted" by people working on government contracts. Were you aware that those results are reviewed before being accepted by the government? That the "findings" are sent back for more "analysis" when they don't show what the agency wants?

how do you know?

One of my customers volunteered the information during conversation about a year ago. It was one of the reasons he left the company.

So you "know a guy"?

Yeah, thats as credible as a chain email.
 
Global warming seems to be the new "Normal". This has been the warmest March on record. We are having forest fires in New York state , brush fires on the EAST coast. Destructive tornadoes in the west in March. This is disturbing. Someone here wants to imply the weather is somehow, NORMAL? Not buying it, buddy. Something is wrong with that evaluation based on first hand experience. I add, a tornado alert has gone off near my house, ironically. We have never had that THIS happen this early in the year...
 
Last edited:
A much better view here;

http://nsidc.org/data/seaice_index/images/daily_images/N_stddev_timeseries.png

Note that it never got up to the normal high. Not only that, but now is descending faster than the mean line. The maximum extent never got to 14 million square kilometers, and is now descending rapidly.

http://arctic.atmos.uiuc.edu/cryosphere/IMAGES/seaice.area.arctic.png

So, you have failed to demonstrate any increase in extent, compared to the prior records, care to try for volume?

It looks like variations in a normal range.

One thing for sure I don't see "wider and wider swings"

Can you quantify that statement?


How about you quantify yours first. You have made the claim. YOU must set the parameters and then defend it. Good luck, you'll need it. All empirical data is against you.
 
Global warming seems to be the new "Normal". This has been the warmest March on record. We are having forest fires in New York state , brush fires on the EAST coast. Destructive tornadoes in the west in March. This is disturbing. Someone here wants to imply the weather is somehow, NORMAL? Not buying it, buddy. Something is wrong with that evaluation based on first hand experience. I add, a tornado alert has gone off near my house, ironically. We have never had that THIS happen this early in the year...


Go back and read some history then. NOTHING that is happening now is new. It's only new to YOU. Your life span is an instant compared to the planet. Go back and look up climate cycles and you'll see that everything is within normal variability. Better yet, look up the weather reports from your local newspaper from 50 and 100 years ago. You'll be amazed at what you find.
 
Global warming seems to be the new "Normal". This has been the warmest March on record. We are having forest fires in New York state , brush fires on the EAST coast. Destructive tornadoes in the west in March. This is disturbing. Someone here wants to imply the weather is somehow, NORMAL? Not buying it, buddy. Something is wrong with that evaluation based on first hand experience. I add, a tornado alert has gone off near my house, ironically. We have never had that THIS happen this early in the year...


Last year in Indiana, the Winter arrived early and then hung on late into spring. This year is a nice break and it is quite warm in the US. However, it's not so warm elsewhere, like Europe.

Even where i grew up, though in Northern minnesota they say it was a soft winter which is to say that the skiing was not so good.

Personnally I love this. The March heat wave ended around here and it's suddenly quite seasonal again and I wish it was warmer.
 
Global warming seems to be the new "Normal". This has been the warmest March on record. We are having forest fires in New York state , brush fires on the EAST coast. Destructive tornadoes in the west in March. This is disturbing. Someone here wants to imply the weather is somehow, NORMAL? Not buying it, buddy. Something is wrong with that evaluation based on first hand experience. I add, a tornado alert has gone off near my house, ironically. We have never had that THIS happen this early in the year...

Once is an anomoly

Twice is a coincidence

Three times is a pattern

This last winter certainly has people talking about climate change and while its very possible this winter was a sign of things to come, until we see three years like that its not a pattern.

OH and for those that say its IMPOSSIBLE for us to effect our climate:


Dust Bowl - Wikipedia, the free encyclopedia

During early European and American exploration of the Great Plains, the region in which the Dust Bowl occurred was thought unsuitable for European-style agriculture; the region was known as the Great American Desert. The lack of surface water and timber made the region less attractive than other areas for pioneer settlement and agriculture. Following the Civil War, settlement was encouraged by the Homestead Act, the transcontinental railroad, and waves of new immigrants, and cultivation increased.[3][4] An unusually wet period in the Great Plains mistakenly led settlers and the federal government to believe that "rain follows the plow" (a popular phrase among real estate promoters) and that the climate of the region had changed permanently.[5] The initial agricultural endeavors were primarily cattle ranching, with some cultivation; however, a series of harsh winters beginning in 1886, coupled with overgrazing followed by a short drought in 1890, led to an expansion of land under cultivation.

Continued waves of immigration from Europe brought settlers to the plains at the beginning of the 20th century. A return of unusually wet weather confirmed a previously held opinion that the "formerly" semiarid area could support large-scale agriculture. Technological improvements led to increase of mechanized plowing, which allowed for cultivation on a greater scale. World War I increased agricultural prices, which also encouraged farmers to dramatically increase cultivation. In the Llano Estacado, the area of farmland doubled between 1900 and 1920, and land under cultivation more than tripled between 1925 and 1930.[6] Finally, farmers did not use appropriate practices for the environment, but agricultural methods that allowed erosion.[1] For example, cotton farmers left fields bare over winter months, when winds in the High Plains are highest, and burned the stubble (as a form of weeding prior to planting), both depriving the soil of organic nutrients and increasing exposure to erosion.

The increased exposure to erosion was revealed when severe drought struck the Great Plains through the 1930s. The native grasses that once covered the prairie lands for centuries, holding the soil in place and maintaining its moisture, had been eliminated by the intensively increased plowing. The drought conditions caused the topsoil to grow dry and friable, and was carried away by the wind.

Its time to wake up. Global Warming may or may not be happening, but its entirely possible that we ARE having an effect as we have had an effect before. Less than a hundred years ago in fact.
 
One of the coldest winters for England in a long time. You understand there's weather and then there's climate right?
 
actual observations? Now that's funny. Try satellite images "interpreted" by people working on government contracts. Were you aware that those results are reviewed before being accepted by the government? That the "findings" are sent back for more "analysis" when they don't show what the agency wants?

how do you know?

one of my customers volunteered the information during conversation about a year ago. It was one of the reasons he left the company.

lol!


BTW - I witnessed the Martin shooting.
 
A much better view here;

http://nsidc.org/data/seaice_index/images/daily_images/N_stddev_timeseries.png

Note that it never got up to the normal high. Not only that, but now is descending faster than the mean line. The maximum extent never got to 14 million square kilometers, and is now descending rapidly.

http://arctic.atmos.uiuc.edu/cryosphere/IMAGES/seaice.area.arctic.png

So, you have failed to demonstrate any increase in extent, compared to the prior records, care to try for volume?

It looks like variations in a normal range.

One thing for sure I don't see "wider and wider swings"

Can you quantify that statement?

Sure.

Old Rocks claims that AGW causes "wider and wider swings" and so far none of the graphs posted have shown any evidence of that
 

Forum List

Back
Top