Record-Shattering February Warmth Bakes Alaska, Arctic 18°F Above Normal

Large portions of India, Pakistan, Egypt, West Africa, Australia and the midwestern USA.

A 5C rise will result in days with wet bulb temperatures of over 35C, which is lethal to any human or large animal that can't get into an air conditioned space. At that combination of temperature and humidity, a person resting in the shade next to a fan still overheats and dies. Conditions like that would only be seen on the hottest days, but it would only take one such day to kill everyone.

And even if you can AC the people, the crops still die. For example, corn dies after a few hours at 110F. And all the livestock dies, and much of the wildlife.
Really?
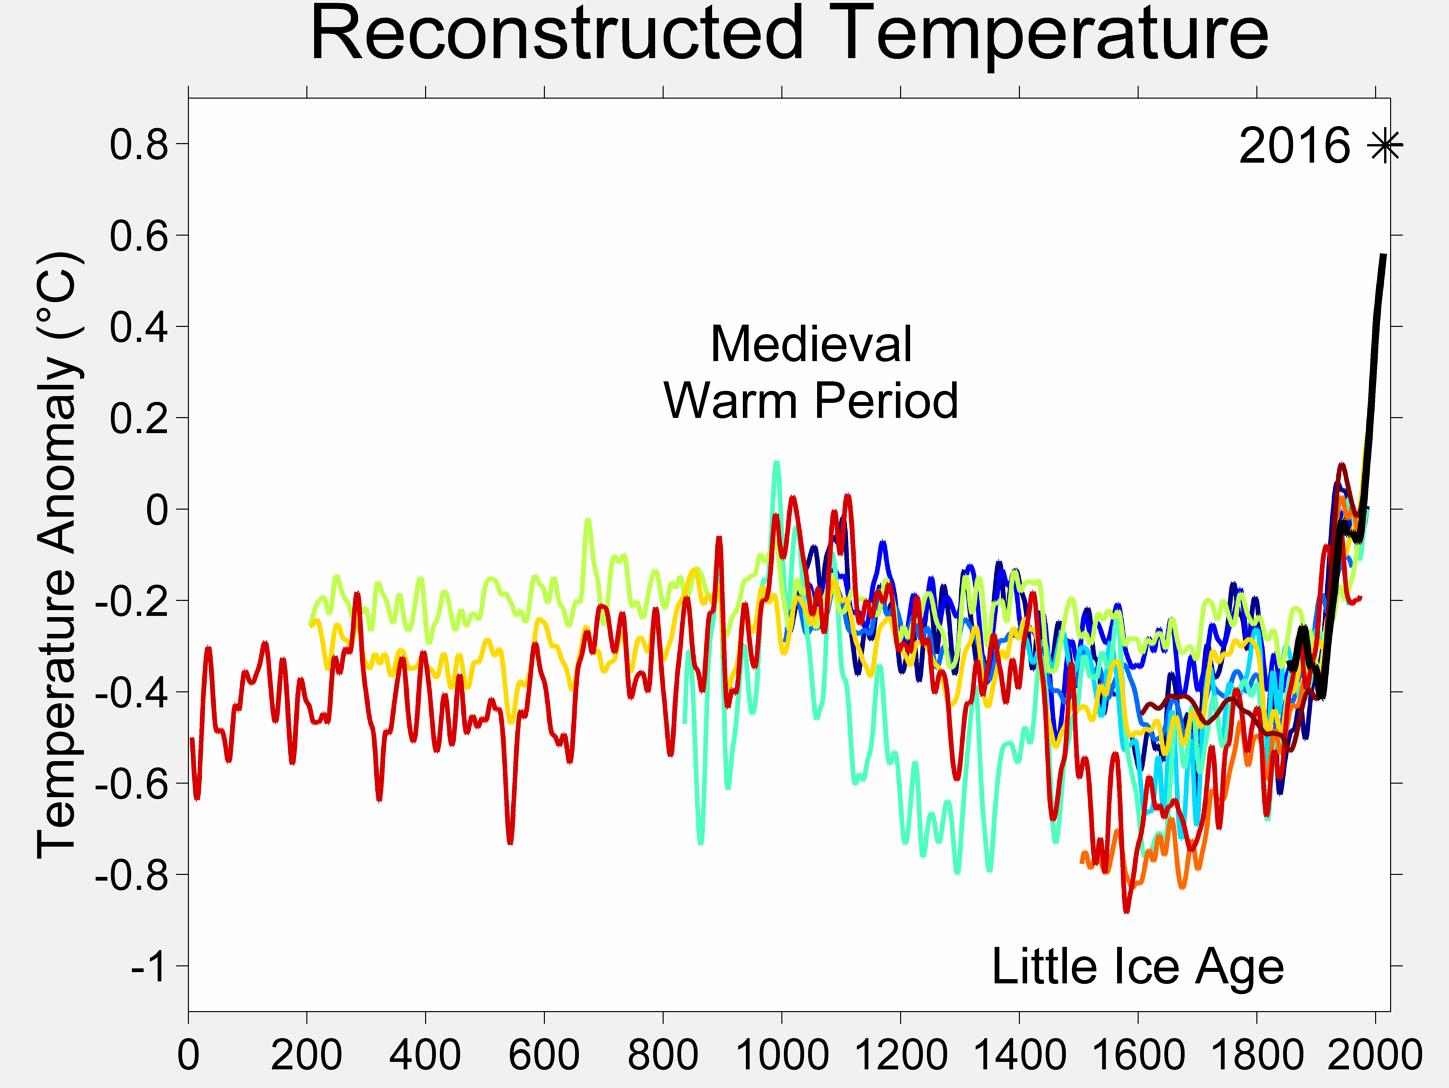
Yet life on the planet was greatest when it was even warmer than a 5C rise (which even cultists are not predicting). Animals that weighed hundreds of tons were walking around enjoying themselves.

Or are you going to now deny the fossil record?

BTW- corn won't germinate unless the ground is 55F, and will happily grow at 110 if provided water.
 
Obviously yes, being that billions of people live there, compared to almost nobody living in the high arctic.

jc, are you going openly mega-genocidal on us, and declaring that it's no biggy if billions of people die?
once you post up the experiment that suggests that is so. Sure, I'll consider it.
 
Yet life on the planet was greatest when it was even warmer than a 5C rise (which even cultists are not predicting). Animals that weighed hundreds of tons were walking around enjoying themselves.

You understand dinosaurs weren't mammals, right?

I suggest you go try out some 35C wet bulb temperatures and tell us how it goes. 104F and 75% humidity will do it, conditions not seen anywhere on earth, ever, at the present time.
 
Record-Shattering February Warmth Bakes Alaska, Arctic 18°F Above Normal

by Joe Romm Mar 13, 2016 1:05 pm

Feb2-16NASA.jpg

CREDIT: NASA

Share 830
Tweet
How hot was it last month globally? It was so hot that the famed Iditarod sled race in Alaska brought in extra snow from hundreds of miles away by train.

It was so hot that NASA now reports that last month beat the all-time global record for hottest February by a stunning 0.85°F, when such records are usually measured in hundredths of a degree.

NASA2-16Tamino-638x382.jpeg

Global mean surface temperature (anomaly from 1951-1980 mean). NASA data (h/t Tamino). Red dot is February.

It was so hot last month that large parts of the Arctic averaged more than 18°F (10°C) above normal. Not only did last month easily set the record for lowest February Arctic sea ice extent, as the National Snow and Ice Data Center (NSIDC) reported, but Arctic sea ice growth has been almost flat for over a month during a time when it normally soars to its annual maximum.

Feb2-16NSIDC-638x499.jpg

It was so hot that February had the single biggest recorded monthly temperature anomaly (deviation from the 1951-1980 average temperature) — a whopping 2.4°F (1.35°C) above the average temperature for the month. The previous record deviation from the average — 2.0°F (1.13°C) — you may recall, was set in January.
----

It is becoming clear that global warming + the nino is doing some extreme stuff. We need to all agree as it is obvious.
Great news! Now weather = climate again and more places are habitable for people.
Call us when palm trees and crocodiles return to Alaska.
And still using the cherry picked data to determine the median again, love the dishonesty!

It is really amazing that you have no idea how utterly insane you always sound, WitheredMan.

Nothing in the OP even remotely hinted at your braindead comment that "Now weather = climate again".

Your crackpot conspiracy theories - "still using the cherry picked data" - about all of the world's scientists are as ridiculous and absurd as always.

How does it feel to be a retarded troll, WitheredMan? You seem to be the 'expert' on that point.
Not my fault you're an idiot at statistics.
And other things.

Not my fault you don't know your ass from a hole in the ground, WitheredMan. Too bad you are such a delusional retard! Such a shame you hallucinate that you know more about anything, including "statistics", than all of the world's actual scientists. You poor brain damaged imbecile.
Hilarious coming from the moron who thinks 1981 - 2010 represents world history.

Even more hilarious is the fact that you are so ignorant and retarded, WitheredMan, that you don't even understand what climate scientists mean by a month by month temperature baseline using the average temperature for each month over the period from 1951 to 1980, or why they measure current temperature as anomalies from the baseline temperature for that month. You are a clueless troll, putting on airs like you actually know something, when your every post demonstrates that you don't know shit from shoe polish.
Not only do you cherry pick data you cherry pick which chart I was talking about. Using 1981-2010 as a mean sea ice extent is 100% dishonest and unscientific.
More denial of reality and the fundamentals of scientific data analysis based only on your own almost complete ignorance and stupidity, and your very obvious severe affliction with the Dunning-Kruger Effect - "A way to summarize these results is to say that those who are truly stupid are too stupid to realize that they are stupid. As Dunning has put it, slightly less colorfully: 'If you're incompetent, you can’t know you’re incompetent.…The skills you need to produce a right answer are exactly the skills you need to recognize what a right answer even is'."

As far as using the period from 1981 to 2010 as a baseline for changes in modern ice extent, as Old Rocks just told you....

Now, silly ass, the reason for picking those dates is that is the first period that we had active satellite observation of the polar caps.
Trying to justify distorting statistics, typical unscientific cultist.
Nope! Tring to explain statistics to a demented denier cultist like you who is terminally ignorant and completely full of fraudulent mistaken bullshit.


Nobody cares about using 1981-2010 as a baseline except liars who need to lie to support their cultist views.
"Nobody" except for all of the world's scientists who use the satellite records of the Arctic to study the warming and loss of ice there. Nobody cares about your denier cult myths and denial of reality, dumbass.


Sea ice extent records go well beyond 1981-2010.
Not satellite records. That started in 1979.

There are sea ice extent records that go back further in time, and they all show that sea ice extent was much higher and with thicker ice, the further back you go.

The records indicate that sea ice extent in the early 1950s was about 5.5 million square miles, with a lot more thick, multi-year ice. In 2012, sea ice extent reached a new record low of only 1.32 million square miles, with very little thick, multi-year ice left, and mostly thin, first-year ice.


The only reason for cherry picking those years is it distorts reality enough to support your lies.
The only reason that you jump to that conclusion, WitheredMan, is because you are a demented retard who is gullible enough to fall for really, really crackpot conspiracy theories about all of the world's climate scientists.


Gorebal Warmers are the most unscientific people on the planet.
That must be why virtually the entire world scientific community supports the conclusions of the climate scientists.....LOLOLOL....you poor delusional denier cult retard.


Even flat earthers and man never went to the moon cults.

Your little deranged cult of AGW denial is even more crackpot than the Flat Earth Society, numbnuts!

LOLOLOLOLOL......your whole post amounts to ignorance being used to justify ignorance, and then masquerading as knowledge. You are both absurd and hilarious!
 
Last edited:
So now can you show us the lab work demonstrating how a 120PPM increase in CO2 can raise temperatures 2F?

Aside from the fact that such lists have been shown to you many times now, you flaming troll....

The actual topic of this thread is...
Record-Shattering February Warmth Bakes Alaska, Arctic 18°F Above Normal

So take your off-topic, thread-derailing bullshit and shove it back up your ass, CrazyFruitcake!

Post one (1) lab experiment that tests for a 120PPM increase in CO2
 
Yet life on the planet was greatest when it was even warmer than a 5C rise (which even cultists are not predicting). Animals that weighed hundreds of tons were walking around enjoying themselves.

You understand dinosaurs weren't mammals, right?

I suggest you go try out some 35C wet bulb temperatures and tell us how it goes. 104F and 75% humidity will do it, conditions not seen anywhere on earth, ever, at the present time.

Again, you don't know much about anything.
Animal: a living organism that feeds on organic matter, typically having specialized sense organs and nervous system and able to respond rapidly to stimuli.

104, 75% humidity? Cool day compared to all the time I spent in Southeast Asia.
Where life is VERY prolific.

Keep following my posts, I'll keep educating you.
 
Record-Shattering February Warmth Bakes Alaska, Arctic 18°F Above Normal

by Joe Romm Mar 13, 2016 1:05 pm

Feb2-16NASA.jpg

CREDIT: NASA

Share 830
Tweet
How hot was it last month globally? It was so hot that the famed Iditarod sled race in Alaska brought in extra snow from hundreds of miles away by train.

It was so hot that NASA now reports that last month beat the all-time global record for hottest February by a stunning 0.85°F, when such records are usually measured in hundredths of a degree.

NASA2-16Tamino-638x382.jpeg

Global mean surface temperature (anomaly from 1951-1980 mean). NASA data (h/t Tamino). Red dot is February.

It was so hot last month that large parts of the Arctic averaged more than 18°F (10°C) above normal. Not only did last month easily set the record for lowest February Arctic sea ice extent, as the National Snow and Ice Data Center (NSIDC) reported, but Arctic sea ice growth has been almost flat for over a month during a time when it normally soars to its annual maximum.

Feb2-16NSIDC-638x499.jpg

It was so hot that February had the single biggest recorded monthly temperature anomaly (deviation from the 1951-1980 average temperature) — a whopping 2.4°F (1.35°C) above the average temperature for the month. The previous record deviation from the average — 2.0°F (1.13°C) — you may recall, was set in January.
----

It is becoming clear that global warming + the nino is doing some extreme stuff. We need to all agree as it is obvious.
Great news! Now weather = climate again and more places are habitable for people.
Call us when palm trees and crocodiles return to Alaska.
And still using the cherry picked data to determine the median again, love the dishonesty!

It is really amazing that you have no idea how utterly insane you always sound, WitheredMan.

Nothing in the OP even remotely hinted at your braindead comment that "Now weather = climate again".

Your crackpot conspiracy theories - "still using the cherry picked data" - about all of the world's scientists are as ridiculous and absurd as always.

How does it feel to be a retarded troll, WitheredMan? You seem to be the 'expert' on that point.
Not my fault you're an idiot at statistics.
And other things.

Not my fault you don't know your ass from a hole in the ground, WitheredMan. Too bad you are such a delusional retard! Such a shame you hallucinate that you know more about anything, including "statistics", than all of the world's actual scientists. You poor brain damaged imbecile.
Hilarious coming from the moron who thinks 1981 - 2010 represents world history.

Even more hilarious is the fact that you are so ignorant and retarded, WitheredMan, that you don't even understand what climate scientists mean by a month by month temperature baseline using the average temperature for each month over the period from 1951 to 1980, or why they measure current temperature as anomalies from the baseline temperature for that month. You are a clueless troll, putting on airs like you actually know something, when your every post demonstrates that you don't know shit from shoe polish.
Not only do you cherry pick data you cherry pick which chart I was talking about. Using 1981-2010 as a mean sea ice extent is 100% dishonest and unscientific.
More denial of reality and the fundamentals of scientific data analysis based only on your own almost complete ignorance and stupidity, and your very obvious severe affliction with the Dunning-Kruger Effect - "A way to summarize these results is to say that those who are truly stupid are too stupid to realize that they are stupid. As Dunning has put it, slightly less colorfully: 'If you're incompetent, you can’t know you’re incompetent.…The skills you need to produce a right answer are exactly the skills you need to recognize what a right answer even is'."

As far as using the period from 1981 to 2010 as a baseline for changes in modern ice extent, as Old Rocks just told you....

Now, silly ass, the reason for picking those dates is that is the first period that we had active satellite observation of the polar caps.
Trying to justify distorting statistics, typical unscientific cultist.
Nope! Tring to explain statistics to a demented denier cultist like you who is terminally ignorant and completely full of fraudulent mistaken bullshit.


Nobody cares about using 1981-2010 as a baseline except liars who need to lie to support their cultist views.
"Nobody" except for all of the world's scientists who use the satellite records of the Arctic to study the warming and loss of ice there. Nobody cares about your denier cult myths and denial of reality, dumbass.


Sea ice extent records go well beyond 1981-2010.
Not satellite records. That started in 1979.

There are sea ice extent records that go back further in time, and they all show that sea ice extent was much higher and with thicker ice, the further back you go.

The records indicate that sea ice extent in the early 1950s was about 5.5 million square miles, with a lot more thick, multi-year ice. In 2012, sea ice extent reached a new record low of only 1.32 million square miles, with very little thick, multi-year ice left, and mostly thin, first-year ice.


The only reason for cherry picking those years is it distorts reality enough to support your lies.
The only reason that you jump to that conclusion, WitheredMan, is because you are a demented retard who is gullible enough to fall for really, really crackpot conspiracy theories about all of the world's climate scientists.


Gorebal Warmers are the most unscientific people on the planet.
That must be why virtually the entire world scientific community supports the conclusions of the climate scientists.....LOLOLOL....you poor delusional denier cult retard.


Even flat earthers and man never went to the moon cults.

Your little deranged cult of AGW denial is even more crackpot than the Flat Earth Society, numbnuts!

LOLOLOLOLOL......your whole post amounts to ignorance being used to justify ignorance, and then masquerading as knowledge. You are both absurd and hilarious!
Do you know where this is? Hint: it's a Federal facility.
image.jpeg
 
And yet the traditional St. Patrick's Day blizzard is forecast to arrive right on schedule.....
I did not know that they held St. Patrick's Day parades in Alaska, HairyGlueHuffer. Unless you're just trying to derail the thread and you are talking about New York City and Boston....in which case you are mistaken...and nuts. Showers are predicted.

Meanwhile, back in the real world....

St. Patrick's Day: Rain may dampen festivities in NYC, Chicago and New Orleans
By Renee Duff, meteorologist
March 15, 2016
As millions make plans to celebrate St. Patrick's Day (March 17), snow, rain and thunderstorms threaten to put a damper on festivals, parades and block parties on Thursday.

Whether you are participating in a parade, enjoying an Irish festival or traveling to other festivities, know exactly when rain, snow or thunderstorms will impact St. Patrick's Day celebrations before you head out with AccuWeather MinuteCast®.


650x366_03150452_page-1.jpg
 
104, 75% humidity? Cool day compared to all the time I spent in Southeast Asia.

Bullshit.

So, we can mark down "weather" as yet another topic that you're just completely ignorant of.

Now, you can easily prove you're not gutless and stupid. Just show a verified measurement, from anywhere on earth, of 104F/75% humidity conditions.

You won't, of course, because you just keep making stupid crap up, and you don't have the guts to admit you're doing that. I await whatever new creative excuse you're going to come up with to cover your retreat here.
 
Yet life on the planet was greatest when it was even warmer than a 5C rise (which even cultists are not predicting). Animals that weighed hundreds of tons were walking around enjoying themselves.

You understand dinosaurs weren't mammals, right?

I suggest you go try out some 35C wet bulb temperatures and tell us how it goes. 104F and 75% humidity will do it, conditions not seen anywhere on earth, ever, at the present time.
You ever been in Houston, St. Louis, Chicago? Holy crap, that is a really stupid statement to make High humidity cities still get temperatures above 100F fool. Maybe only a week's worth, and Houston would be the outlier there.
 
Last edited:
You ever been in Houston, St. Louis, Chicago? Holy crap, that is a really stupid statement to make High humidity cities still get temperatures above 100F fool. Maybe only a week's worth, but Houston would be the outlier there.

Weatherman was making shit up, and you're now making stupid shit up too.

If you disagree, it will be easy to prove you're not being a moron. The temperature records in the USA are well-documented and online. Just go into them and show us these days of 104F and 75% humidity.

Such days don't happen, ever. And while we're on the topic, 90F days with 90% humidity don't ever happen either in the USA. What we would consider an unbearably hot and humid day would have 50% humidity, not 90%.
 
104, 75% humidity? Cool day compared to all the time I spent in Southeast Asia.

Bullshit.

So, we can mark down "weather" as yet another topic that you're just completely ignorant of.

Now, you can easily prove you're not gutless and stupid. Just show a verified measurement, from anywhere on earth, of 104F/75% humidity conditions.

You won't, of course, because you just keep making stupid crap up, and you don't have the guts to admit you're doing that. I await whatever new creative excuse you're going to come up with to cover your retreat here.
First, you show us the link to any climate model stating 104, 75RH across the globe.

Second, 95F, 73RH is an AVERAGE in Phnom Penh. So kiss my ass, ignoramous.

image.gif
 
You ever been in Houston, St. Louis, Chicago? Holy crap, that is a really stupid statement to make High humidity cities still get temperatures above 100F fool. Maybe only a week's worth, but Houston would be the outlier there.

Weatherman was making shit up, and you're now making stupid shit up too.

If you disagree, it will be easy to prove you're not being a moron. The temperature records in the USA are well-documented and online. Just go into them and show us these days of 104F and 75% humidity.

Such days don't happen, ever. And while we're on the topic, 90F days with 90% humidity don't ever happen either in the USA. What we would consider an unbearably hot and humid day would have 50% humidity, not 90%.
Climate of Houston - Wikipedia, the free encyclopedia

"Summer
June through August in Houston is very hot and humid, often with scattered afternoon showers and thunderstorms. At George Bush Intercontinental Airport, the normal daily high temperature peaks at 95.0 °F (35.0 °C) on 5–12 August,[1] with a normal of 102.4 days per year at or above 90 °F (32 °C) and 3.5 days per year at or above 100 °F (38 °C).[1] The average relative humidity ranges from over 90 percent in the morning to around 60 percent in the afternoon.[6] The temperatures in the summer in Houston are very similar to average temperatures seen in tropical climates, such as in the Philippines and Central America.[7] The values of relative humidity results in a heat index higher than the actual temperature.[8] The highest temperature ever recorded at George Bush Intercontinental Airport was 109 °F (43 °C) on September 4, 2000[9] and on August 27, 2011.[10] On June 29, 2013, the temperature at George Bush Intercontinental Airport reached 107 °F (42 °C), the highest ever recorded in June.[11] Heat stroke can strike people who stay outdoors for long periods of time during the summer, making hydration essential for outdoor work and recreational activity.[12] The 2014 summer season did not yield 100+ degree weather in response to the monsoon-esque rainfall during late June to August.

Heat and humidity of Houston make air-conditioning important in day-to-day life.[13] Most indoor workers spend the hottest part of the day in air conditioning. After World War II, air conditioning stimulated the growth of Houston, called the most air-conditioned city in the world in 1950.[14] For construction workers, landscapers, and others who must work outdoors, there is little relief from the summer heat and humidity. Industrial workers, automobile mechanics and others who usually work in non-air conditioned indoor spaces often rely on large electric fans to provide some relief."

Well?
 

Well, you notably failed to show any cases of 104F with 75% humidity AT THE SAME TIME.

Your attempted deception there was you trying to pretend "90% humidity in the morning" meant "90% humidity in the afternoon when it was much hotter".

So, my point stands. There are no recorded instances anywhere ever of 104F with 75% humidity.
you asked and I delivered.
You delivered your usual load of deranged fraudulent bullshit, JustCrazy.

Everybody sees it.
 

Forum List

Back
Top