Fort Fun Indiana
Diamond Member
- Mar 10, 2017
- 97,669
- 74,367
- 3,645
Maybe try getting your info NOT from paid liars at the Federalist society.Where is the increase coming from?
NOAA says not Major Tornadoes.
View attachment 592380
===
No increase in Landfalling Hurricanes,
View attachment 592383
LINK
===
No increase in Hurricane strength or Frequency,
View attachment 592385
===
No increase in Typhoons either since 1951,
View attachment 592386
===
Droughts are DECREASING in the 48 states,
View attachment 592387
===
Decreasing Wildfires NASA
View attachment 592388
LINK
NASA very similar chart
===
View attachment 592391
===
View attachment 592394
===
View attachment 592396
===
quote from the Intergovernmental Panel on Climate Change (IPCC):
===
No increase in HOT days,
View attachment 592398
===
Plummeting death rate since 1920,
View attachment 592399
LINK
===
and the best for last:
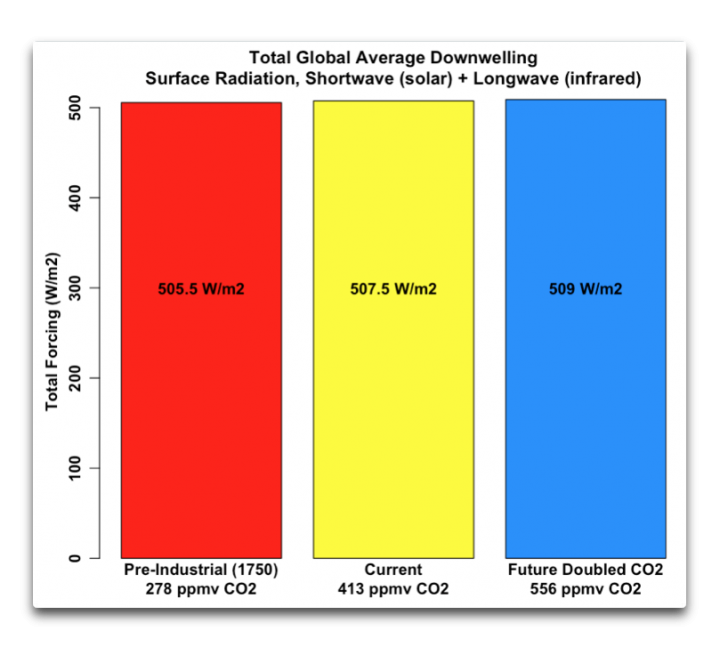
Next, here is the radical change in downwelling radiation at the surface from the increase in CO2 that is supposed to be driving the “CLIMATE EMERGENCY!!!” What I’ve shown is the change that in theory would have occurred from the changes in CO2 from 1750 to the present, and the change that in theory will occur in the future when CO2 increases from its present value to twice the 1750 value. This is using the generally accepted (although not rigorously derived) claim that the downwelling radiation change from a doubling of CO2 is 3.5 watts per square metre (W/m2). The purpose is to show how small these CO2-caused changes are compared to total downwelling radiation.

The changes in downwelling radiation from the increase in CO2 are trivially small, lost in the noise …
LINK
I only fact checked one of your charts. Naturally, it is misleading and created by paid deniers to fool the denier rubes
Here is the ACTUAL chart of tornado energy over the past decades. See a trend?:
Last edited:


