mamooth
Diamond Member
Any flaws you can spot in post #5?
Step 7 claims to follow from step 6, but doesn't. Step 7 is just a weird invention. Hence, everything that follows step 7 is nonsense.
Follow along with the video below to see how to install our site as a web app on your home screen.
Note: This feature may not be available in some browsers.
Any flaws you can spot in post #5?
Can you pick a fucking story and stick to it?
Most of the deniers here display some form of mental illness or personality disorder.
1. Histrionic personality disorder (attention seeking and extreme emotionalism)
2. Paranoia. (The world is conspiring against us!)
3. Narcissism. (I am incapable of error and know better than the best minds on the planet!)
4. Sociopathy (Lying for my cult is justified!)
Frank scores very high in #1 and #4.
Any flaws you can spot in post #5?
Step 7 claims to follow from step 6, but doesn't. Step 7 is just a weird invention. Hence, everything that follows step 7 is nonsense.
Any flaws you can spot in post #5?
Step 7 claims to follow from step 6, but doesn't. Step 7 is just a weird invention. Hence, everything that follows step 7 is nonsense.
Step 7 claims to follow from step 6, but doesn't. Step 7 is just a weird invention.
An upper bound for the power supplied directly by doubling CO2 concentration is log 2 times the effect of the present concentration, by 6. By 5, that effect is 1.6 watts per square meter so the bound on the direct effect is 0.693 x 1.6 = 1.11 additional watts per square meter. Notice, this is less than 1/6th the figure calculated above as necessary to raise mean surface temperature by 1C.
So what is the power supplied by doubling the present concentration of CO2?

So what is the power supplied by doubling the present concentration of CO2?
Plagiarize? Note the link directly above the paste from the American Institute of Physics statement on CO2? Ian, your posts are increasingly resembling those of Billy Boob and Frankie Boy.Many. The primary on has to do with how CO2 works. From the American Institute of Physics
Simple Models of Climate
=> Radiation math
That’s a shorthand way of explaining the greenhouse effect — seeing it from below, from "inside" the atmosphere. Unfortunately, shorthand arguments can be misleading if you push them too far. Fourier, Tyndall and most other scientists for nearly a century used this approach, looking at warming from ground level, so to speak, asking about the radiation that reaches and leaves the surface of the Earth. So they tended to think of the atmosphere overhead as a unit, as if it were a single sheet of glass. (Thus the "greenhouse" analogy.) But this is not how global warming actually works, if you look at the process in detail.
What happens to infrared radiation emitted by the Earth's surface? As it moves up layer by layer through the atmosphere, some is stopped in each layer. (To be specific: a molecule of carbon dioxide, water vapor or some other greenhouse gas absorbs a bit of energy from the radiation. The molecule may radiate the energy back out again in a random direction. Or it may transfer the energy into velocity in collisions with other air molecules, so that the layer of air where it sits gets warmer.) The layer of air radiates some of the energy it has absorbed back toward the ground, and some upwards to higher layers. As you go higher, the atmosphere gets thinner and colder. Eventually the energy reaches a layer so thin that radiation can escape into space.
What happens if we add more carbon dioxide? In the layers so high and thin that much of the heat radiation from lower down slips through, adding more greenhouse gas means the layer will absorb more of the rays. So the place from which most of the heat energy finally leaves the Earth will shift to higher layers. Those are colder layers, so they do not radiate heat as well. The planet as a whole is now taking in more energy than it radiates (which is in fact our current situation). As the higher levels radiate some of the excess downwards, all the lower levels down to the surface warm up. The imbalance must continue until the high levels get warmer and radiate out more energy. As in Tyndall's analogy of a dam on a river, the barrier thrown across the outgoing radiation forces the level of temperature everywhere beneath it to rise until there is enough radiation pushing out to balance what the Sun sends in.
Old Rocks- you shouldn't plagiarize other people's words. For a moment I actually thought you were putting together a somewhat cogent statement.
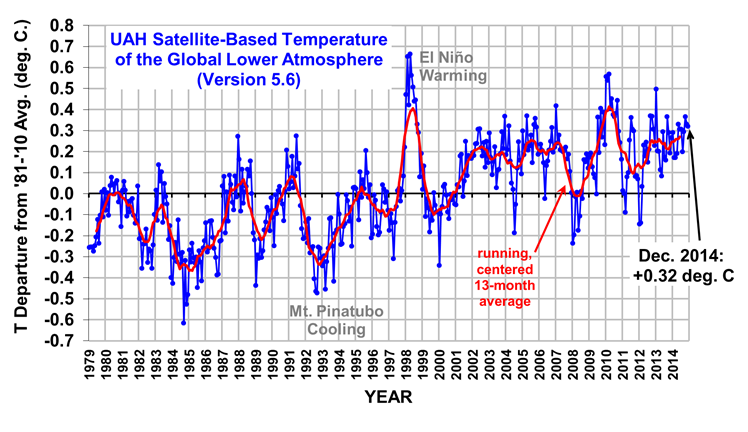
The last 20 years is the first time in temperature recording it is dead balls accurate. I don't see a trend, 20 years is not enough data. Get back to me in 2080According to the UAH, 2014 is 'only' the third warmest year on record.
Annual Global Temperature Anomalies, ranked
1. 1998 0.42
2. 2010 0.40
3. 2014 0.27
4. 2005 0.26
5. 2013 0.24
6. 2002 0.22
7. 2009 0.21
8. 2007 0.20
9. 2003 0.19
10. 2006 0.19
11. 2012 0.17
12. 2011 0.13
13. 2004 0.11
14. 2001 0.11
15. 1991 0.02
16. 1987 0.01
17. 1995 0.01
18. 1988 0.01
19. 1980 -0.01
20. 2008 -0.01
Of the last 20 years, 16 have been the warmest years on record. Note that in this list of the warmest 20 years on record, the earliest is 1980. 2015 will be a very interesting year.

and still nothing of substance. You do nothing but play tag all day on here. selfish.Can you pick a fucking story and stick to it?
Most of the deniers here display some form of mental illness or personality disorder.
1. Histrionic personality disorder (attention seeking and extreme emotionalism)
2. Paranoia. (The world is conspiring against us!)
3. Narcissism. (I am incapable of error and know better than the best minds on the planet!)
4. Sociopathy (Lying for my cult is justified!)
Frank scores very high in #1 and #4.
another tag moment.Any flaws you can spot in post #5?
Step 7 claims to follow from step 6, but doesn't. Step 7 is just a weird invention. Hence, everything that follows step 7 is nonsense.
says the clown that keeps posting inaccurate data from UAH. Yeah, how many times have you been told old clown?LOL. OK, Bear. Glad to see that you don't think scientists know anything. That tells me how much you know.
Plagiarize? Note the link directly above the paste from the American Institute of Physics statement on CO2? Ian, your posts are increasingly resembling those of Billy Boob and Frankie Boy.Many. The primary on has to do with how CO2 works. From the American Institute of Physics
Simple Models of Climate
=> Radiation math
That’s a shorthand way of explaining the greenhouse effect — seeing it from below, from "inside" the atmosphere. Unfortunately, shorthand arguments can be misleading if you push them too far. Fourier, Tyndall and most other scientists for nearly a century used this approach, looking at warming from ground level, so to speak, asking about the radiation that reaches and leaves the surface of the Earth. So they tended to think of the atmosphere overhead as a unit, as if it were a single sheet of glass. (Thus the "greenhouse" analogy.) But this is not how global warming actually works, if you look at the process in detail.
What happens to infrared radiation emitted by the Earth's surface? As it moves up layer by layer through the atmosphere, some is stopped in each layer. (To be specific: a molecule of carbon dioxide, water vapor or some other greenhouse gas absorbs a bit of energy from the radiation. The molecule may radiate the energy back out again in a random direction. Or it may transfer the energy into velocity in collisions with other air molecules, so that the layer of air where it sits gets warmer.) The layer of air radiates some of the energy it has absorbed back toward the ground, and some upwards to higher layers. As you go higher, the atmosphere gets thinner and colder. Eventually the energy reaches a layer so thin that radiation can escape into space.
What happens if we add more carbon dioxide? In the layers so high and thin that much of the heat radiation from lower down slips through, adding more greenhouse gas means the layer will absorb more of the rays. So the place from which most of the heat energy finally leaves the Earth will shift to higher layers. Those are colder layers, so they do not radiate heat as well. The planet as a whole is now taking in more energy than it radiates (which is in fact our current situation). As the higher levels radiate some of the excess downwards, all the lower levels down to the surface warm up. The imbalance must continue until the high levels get warmer and radiate out more energy. As in Tyndall's analogy of a dam on a river, the barrier thrown across the outgoing radiation forces the level of temperature everywhere beneath it to rise until there is enough radiation pushing out to balance what the Sun sends in.
Old Rocks- you shouldn't plagiarize other people's words. For a moment I actually thought you were putting together a somewhat cogent statement.
The global, hemispheric, and tropical LT anomalies from the 30-year (1981-2010) average for the last 12 months are:
UAH Global Temperature Update for December 2014 0.32 deg. C Roy Spencer PhD
A roller coaster going up.