500 scientists say there is no climate emergency

Though his rule was overturned by the courts, Biden waged war on oil products. Biden ordered electric vehicles be mandated for the Feds. The mark of a dictator. Biden would shut down all coal plants and would refuse to go nuclear. For a source that is only available part time. Wind and solar normally do not produce power at night.
Not really bubba. The clean air act passed by Congress years ago gave the authority to the EPA to regulate emissions. Trump rolled them back, Biden put them back in place. The time line is for “gas powered cars” to be off the market by 2035. The Biden admin has posted time lines to this end. Like all Govt regs, the automobile reps are heavily involved in making these regulation date due.

They are welcome to present their evidence if they need more time or less. The car companies are part of the regulatory process. After all, the customers will die early if they don’t. They aren’t as stupid as you bozos. They want to sell cars to still living customers.
 
God are you fucking stupid. If you want to see the science vist www.ipcc.ch.

The reason there is such a strong consensus is that the scientists - the one whose opinions most matter on science questions - have all been convinced, BY THE FUCKING SCIENCE, that AGW theory is valid.

I gave you many examples of consensus failures you ignored them.

You don't even know what the AGW conjecture is anyway, meanwhile,

NO Tropospheric "hot spot" exist.

No Positive Feedback Loop exist.

The doubling of CO2 from 280ppm to 560 ppm is about he he... ha ha ha... just a sliver of about 3.7 W m/2 against 508 w m/2.

Your inability to accept abundant evidence that CO2 doesn't do shit to the climate at the 440 ppm level is well known which is why so many here look down on you.

Here is the chart you have ignored many times showing no visible CO2 effect on large temperature swings of the last 12,000 years:

Based on the GISP2 HIGH resolution data,

1699574688830.png


CO2 flat for over 10,000 years.

LOL
 
Last edited:
I gave you many examples of consensus failures you ignored them.

You don't even know what the AGW conjecture is anyway, meanwhile,

NO Tropospheric "hot spot" exist.

No Positive Feedback Loop exist.

The doubling of CO2 from 280ppm to 560 ppm is about he he... ha ha ha... just a sliver of about 1.70 W m/2 against 508 w m/2.

Your inability to accept abundant evidence that CO2 doesn't do shit to the climate at the 440 ppm level is well known which is why so many here look down on you.

Here is the chart you have ignored many times showing no visible CO2 effect on large temperature swings of the last 12,000 years:

Based on the GISP2 HIGH resolution data,

View attachment 855940


CO2 flat for over 10,000 years.

LOL
Every time he posts his 10,000 year "global" temperature plot I like to remind him it doesn't compare well to the Greenland ice core data; their "global" temperature doesn't show the fluctuations or that much of the past 10,000 years was warmer than today.
 
I gave you many examples of consensus failures you ignored them.

You don't even know what the AGW conjecture is anyway, meanwhile,

NO Tropospheric "hot spot" exist.

No Positive Feedback Loop exist.

The doubling of CO2 from 280ppm to 560 ppm is about he he... ha ha ha... just a sliver of about 3.7 W m/2 against 508 w m/2.

Your inability to accept abundant evidence that CO2 doesn't do shit to the climate at the 440 ppm level is well known which is why so many here look down on you.

Here is the chart you have ignored many times showing no visible CO2 effect on large temperature swings of the last 12,000 years:

Based on the GISP2 HIGH resolution data,

View attachment 855940


CO2 flat for over 10,000 years.

LOL
Of course….
The industrial revolution didn’t start till the 1800‘s. . It shows clearly that the increase in CO2 is steeper then at any time in the last 10,000. Positive evidence that CO2 is increasing at a RATE Never before seen. See the near vertical line ? That’s rate of change that deniers don’t understand.
 
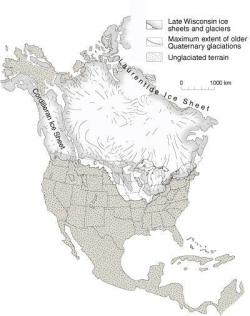
Yep. It’s called a map, learn to read one
So, it’s just a map of Chicago with 2.5 miles of ice over 230 square miles of Chicago. Where can I see this map ? Proof. So far it’s just your crazy fked up story.
 
Of course….
The industrial revolution didn’t start till the 1800‘s. . It shows clearly that the increase in CO2 is steeper then at any time in the last 10,000. Positive evidence that CO2 is increasing at a RATE Never before seen. See the near vertical line ? That’s rate of change that deniers don’t understand.

Meanwhile large temperature swings went on for 10,000 years WITHOUT CO2 involvement........... since it stayed around the 280 ppm line in all that time.

This means YOU are the denier since you ignored point of the chart.
 
Meanwhile large temperature swings went on for 10,000 years WITHOUT CO2 involvement........... since it stayed around the 280 ppm line in all that time.

This means YOU are the denier since you ignored point of the chart.
Exactly, they deny historical records
 
Here is a nice animation by the University of Wisconsin,

LINK to the large video showing that at times the area of Chicago was indeed buried under ice.

LINK
 

Attachments

  • 1699588939996.png
    1699588939996.png
    71.2 KB · Views: 7
Here is a nice animation by the University of Wisconsin,

LINK to the large video showing that at times the area of Chicago was indeed buried under ice.

LINK
Ahh man, dagus is a dufus.

I bet he doesn’t know the difference between the oceans and a continent
 
Last edited:
I gave you many examples of consensus failures you ignored them.
The belief the earth was flat? How analogous was that to the current consensus?
You don't even know what the AGW conjecture is anyway, meanwhile,
It's not a conjecture. It is a very widely accepted and extremely well evidenced theory.
NO Tropospheric "hot spot" exist.
The tropospheric hot spot has been found. I showed your four different studies doing so. You ignore them.
No Positive Feedback Loop exist.
Positive feedbacks to greenhouse warming do exist. It's called water vapor and relative humidity. I wager most sixth graders can understand it.
The doubling of CO2 from 280ppm to 560 ppm is about he he... ha ha ha... just a sliver of about 3.7 W m/2 against 508 w m/2.
If you're going to use actual numbers, you need to quote your sources and tell us whether your talking about ECS or TCR. ECS has a very likely range between 2C and 5C with a best estimate of 3C
Your inability to accept abundant evidence that CO2 doesn't do shit to the climate at the 440 ppm level is well known which is why so many here look down on you.
I have a very widely accepted piece of climate science here that says that the CO2 humans have added to the atmosphere between 1750 and 2019 has increased the Earth's temperature by 1.0 (0.8 - 1.5)C. Now maybe you think that's not "shit" but I do.
1699589700310.png

It has become very common among the deniers here to tell me "so many here look down on you" or similar messages. If any one of them could actually come up with a valid scientific rebuttal for any of the mainstream science I've been posting, then I might be concerned. But being "looked down on" for advocating very widely accepted mainstream science by people with the science knowledge of 4th graders doesn't bother me in the slightest.
Here is the chart you have ignored many times showing no visible CO2 effect on large temperature swings of the last 12,000 years:

Based on the GISP2 HIGH resolution data,

View attachment 855940


CO2 flat for over 10,000 years.

1) Your CO2 record would not be a flat line if the vertical CO2 axis had been scaled properly. That is a childish and blatant attempt at deception.
2) There are several reconstructions of global temperature, why are you using a single GISP2 core known not to track well with global data?
3) Almost every notable warming or cooling period you name here was regional in extent.

The global temperature trend over this time period looks like this:

1699590372491.png


The temperature range over the last 11,000 years, the span your graph covers, is quite limited.

The Earth's CO2 over that period looked like this (the blue dots):

1699590519237.png


Note that the CO2 and temperature track each other quite well across the entire span and that over the last 11,000 years, the span your plot covers, CO2 and temperature are both quite stable.
 

Forum List

Back
Top